Operations | Monitoring | ITSM | DevOps | Cloud

Blog

Driving Efficiency and Advanced Insight - Explore Virtana's Latest Innovations

Virtana is proud to announce a series of new capabilities focused on empowering our customers with advanced AI-driven capabilities, enhanced user interfaces, and deeper integrations, all aimed at optimizing application and infrastructure observability. Let’s dive into these innovations and see how they revolutionize the way IT professionals interact with their environments.

Not Every Problem is an Error: Introducing Rage and Dead Clicks + New User Feedback Reports

I know, we’re Sentry the error and performance monitoring platform and we catch production issues. But as you (hopefully) saw during our Launch Week announcement, some broken experiences simply won’t throw an exception. So we built a way to detect when your users are slamming their keys on the keyboard in frustration, and to even let them contact you directly when that doesn’t go their way.

A Guide to Effective Network Load Testing & Load Balancing

When it comes to network management, there are two challenges that are ever-present; ensuring optimal network performance and maintaining uninterrupted network connectivity. Network admins are the unsung heroes, diligently managing the digital highways that connect the modern world. To maintain the delicate balance between seamless user experience and network reliability, two crucial practices come to the forefront: Network Load Testing and Load Balancing.

Kubecon North America 2023 event recap

As autumn graced the vibrant city of Chicago, I had the distinct opportunity to immerse myself in the heart of innovation and camaraderie at the CNCF’s Kubecon North America conference. Over the span of four remarkable days, from Nov 6-9, I was fortunate enough to walk alongside the many enthusiasts, contributors and organizers of open source and cloud native communities.

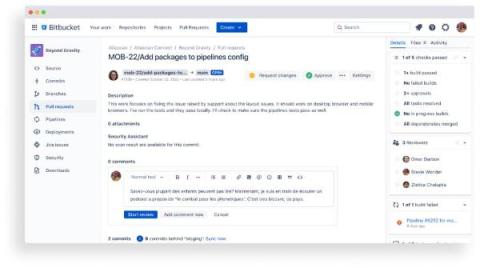
New in pull requests: Batched comments

Bitbucket Cloud is excited to introduce a new feature to streamline the way you communicate pull request feedback to your colleagues. You now have the option on pull requests to batch comments into a single review. By doing this, you submit all your feedback at once, letting other PR participants know – with a single email notification – that you have finished your code review.

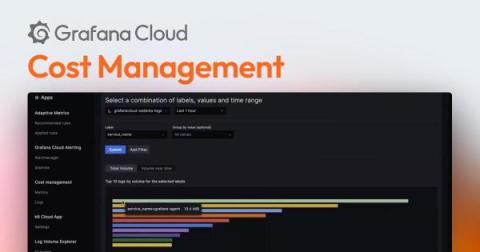
Manage log volumes, metrics cardinality, monthly bills: Explore Grafana Cloud cost management tools

As more organizations adopt observability at massive scale, they have also been grappling with rising costs. Over the past 12 months, we have been working on different solutions to help our users better understand and manage their observability stack, not to mention the bills that come with scaling it.

Out-of-band communication: Maintaining business continuity

Today, most organizations rely on several different secure communication mediums — like email, real-time chat, video calls, and SMS — to transmit information, collaborate, and keep teams aligned. While modern communication tools help teams stay connected, the digital landscape is not without its challenges. For most organizations, it’s only a matter of time before network disruptions, security breaches, and system failures impact main lines of communication.

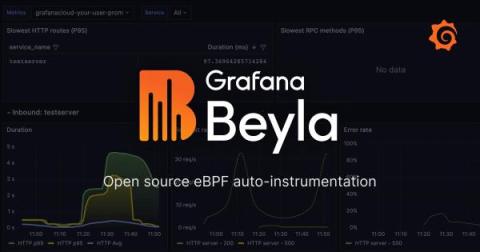
Grafana Beyla 1.0 release: zero-code instrumentation for application telemetry using eBPF

Just two months after introducing the public preview of Grafana Beyla, we are excited to announce the general availability of the open source project with the release of Grafana Beyla 1.0 at ObservabilityCON 2023 today. We’ve worked hard in the last two months to stabilize, stress test, and refine the features that were part of the public preview of this open source eBPF auto-instrumentation tool.