Operations | Monitoring | ITSM | DevOps | Cloud

Elastic

Virtual Elastic{ON} Gov Summit: Mindsets, solutions, and user stories for the future

We hosted our first ever virtual Elastic{ON} Gov Summit with one primary goal: recreate the collaboration and community-building we normally enjoy at our in-person Gov Summit in a new, virtual format. And we were humbled to be able to do just that. The event gathered more than 2,000 registered attendees from across government agencies and partners to collaborate while so many of us were social distancing across the nation.

Tips and Tricks from Elastic Support: Setting up and running your cluster

Setting up and running an Elasticsearch cluster is easy at first, but some planning and design can help preventing many issues when going live gets real and your cluster needs to scale up. Cris da Rocha from the support team at Elastic will present some tips and tricks, learned from the experience of Elastic Support on how to do things better.

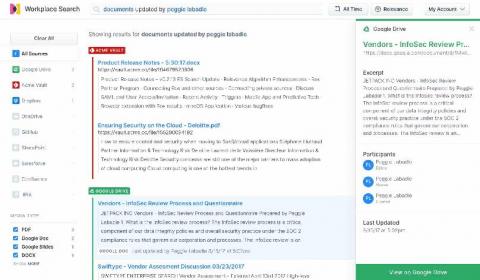
Searching Google Drive: Better collaboration with Elastic Workplace Search

While Google G Suite is an indispensable productivity and collaboration tool for modern businesses, all too frequently content tends to pile up in the far corners of Google Drive, making content search and discovery difficult. Spending valuable time sifting and searching through tens of thousands of documents to find the right one has become all too common, and most workers spend several hours per week searching for information.

How to add powerful (Elastic)search to existing SQL applications

Elasticsearch has a lot of strengths (speed, scale, relevance), but one of its most important strengths is its flexibility to be added to existing environments without the need for any sort of architectural overhaul. If you are a sysadmin (dev, sec, ops, etc.), you know just how appealing this is. So many legacy systems remain in place not because they are perfect, but because replacing them would cost time and money that you don't have.

Identifying and monitoring key metrics for your hosts and systems

This post is the first in a three-part series on how to effectively monitor the hosts and systems in your ecosystem, and we're starting with the one you use most: your personal computer. Metrics are a key part of observability, providing insight into the usage of your systems, allowing you to optimize for efficiency and plan for growth. Let's take a look at the different metrics you should be monitoring.

Dynamic presentations with Canvas

Canvas is data visualization and presentation tool that sits within Kibana. It allows us to pull live data directly from Elasticsearch and combine it with colours, images and text in order to create dynamic and visually appealing presentations. This talk will cover the basics of building your first presentation based on the live data from Elasticsearch. If you enjoy immersing yourself in the creative process while applying your technical skills, you should join us for this talk.

Elastic Observability Engineer Training Preview: Structuring data

Hello! This session will be delivered virtually by Tamara Rosini and Lutf Ur Rehman, Education Engineers at Elastic. They will guide us through the new Elastic Observability Engineer course while providing tips on how to structure data properly as an observability best practice. Properly parsing and structuring your data is an important first step in building an efficient and effective observability solution using the Elastic Stack. Effectively indexing and structuring data into Elasticsearch is critical for establishing efficient search criteria and effective results.

Improving search relevance with boolean queries

When you perform a search in Elasticsearch, results are ordered so that documents which are relevant to your query are ranked highly. However, results that may be considered relevant for one application may be considered less relevant for another application. Because Elasticsearch is super flexible, it can be fine-tuned to provide the most relevant search results for your specific use case(s).

How to easily correlate logs and APM traces for better observability

Application performance monitoring (APM) and logging both provide critical insight into your ecosystem. When paired together with context, they can provide vital clues on how to resolve problems with your applications. As the log data you analyze becomes more complex, navigating to the relevant pieces can be tricky using traditional tools. With Elastic Observability (powered by the Elastic Stack), correlating logs with APM is as simple as a few clicks in Kibana.