Operations | Monitoring | ITSM | DevOps | Cloud

Elastic

Elasticsearch Service on Google Cloud Marketplace: New ways to purchase and discover

Last year we announced an expanded partnership with Google to bring Elasticsearch Service to even more Google Cloud users. We were also named one of Google Cloud's partners of the year! We've since deepened our partnership, and today we are proud to announce new ways to purchase and discover Elasticsearch Service in the Google Cloud Marketplace. You can now purchase monthly Gold and Platinum subscriptions as well as Standard, Gold, and Platinum annual subscriptions through the marketplace.

Exploring Jaeger traces with Elastic APM

Jaeger is a popular distributed tracing project hosted by the Cloud Native Computing Foundation (CNCF). In the Elastic APM 7.6.0 release we added support for ingesting Jaeger traces directly into the Elastic Stack. Elasticsearch has long been a primary storage backend for Jaeger. Due to its fast search capabilities and horizontal scalability, Elasticsearch makes an excellent choice for storing and searching trace data, along with other observability data such as logs, metrics, and uptime data.

Elastic Cloud: Elasticsearch Service API is now GA

The Elastic Cloud console gives you a single place to create and manage your deployments, view billing information, and stay informed about new releases. It provides an easy and intuitive user interface (UI) for common management and administrative tasks. While a management UI is great, many organizations also want an API to automate common tasks and workflows, especially for managing their deployments.

Elastic's Guide to Data Visualization in Kibana

Practitioners the field of data visualizations often talk about 2 types of visualizations: exploratory vs explanatory. To quote Google definitions, “Exploratory data visualizations (EDVs) are the type of visualizations you assemble when you do not have a clue about what information lies within your data. Nov 19, 2018” Explanatory visualization, by contrast, is defined as “what happens when you have something specific you want to show an audience” (Storytelling with data blog, April 2014)

How to implement Prometheus long-term storage using Elasticsearch

Prometheus plays a significant role in the observability area. An increasing number of applications use Prometheus exporters to expose performance and monitoring data, which is later scraped by a Prometheus server. However, when it comes to storage, Prometheus faces some limitations in its scalability and durability since its local storage is limited by single nodes.

Building a Search Engine with Elastic App Search

Building a web application to solve a business problem is easy in today's world. But, how about creating an experience that lets your user spend more time on the service. To do that essentially, we need to equip the application with quintessential features like search. Most of the websites like eCommerce, Food Delivery, Social media rely on search. Search is omnipresent and one can't ignore the users searching for something on your website.

Elastic Stack Alerting Overview

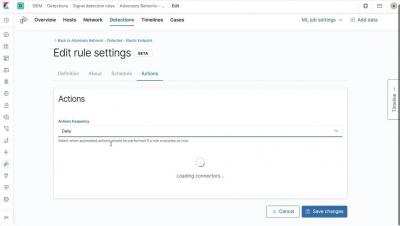
Introducing the new alerting framework for the Elastic Stack bringing alert functionality directly into SIEM, APM, Uptime, and Metrics. The new alerting framework is built from the ground up and designed to offer data-driven triggers that let you do everything from send an email, to automatic Slack notifications, to even integrate with platforms like PagerDuty to initiate escalations.

Elastic Stack 7.7.0 released

We are pleased to announce the general availability of version 7.7 of the Elastic Stack. Like most Elastic Stack releases, 7.7 packs quite a punch. But more than the new features, we’re most proud of the team that delivered it. A feature-packed release like this is special during normal times. But it’s extra special today given the uncertain times we are in right now.