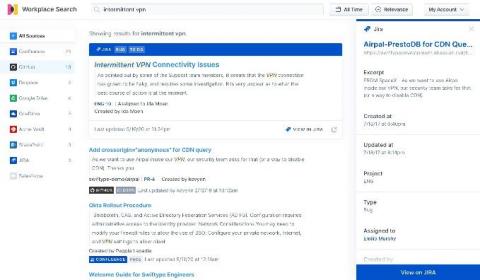
While Google G Suite is an indispensable productivity and collaboration tool for modern businesses, all too frequently content tends to pile up in the far corners of Google Drive, making content search and discovery difficult. Spending valuable time sifting and searching through tens of thousands of documents to find the right one has become all too common, and most workers spend several hours per week searching for information.
Elasticsearch has a lot of strengths (speed, scale, relevance), but one of its most important strengths is its flexibility to be added to existing environments without the need for any sort of architectural overhaul. If you are a sysadmin (dev, sec, ops, etc.), you know just how appealing this is. So many legacy systems remain in place not because they are perfect, but because replacing them would cost time and money that you don't have.
This post is the first in a three-part series on how to effectively monitor the hosts and systems in your ecosystem, and we're starting with the one you use most: your personal computer. Metrics are a key part of observability, providing insight into the usage of your systems, allowing you to optimize for efficiency and plan for growth. Let's take a look at the different metrics you should be monitoring.
When you perform a search in Elasticsearch, results are ordered so that documents which are relevant to your query are ranked highly. However, results that may be considered relevant for one application may be considered less relevant for another application. Because Elasticsearch is super flexible, it can be fine-tuned to provide the most relevant search results for your specific use case(s).
“If it’s not in Salesforce, it didn’t happen.” You’ve undoubtedly heard it, or perhaps you’ve said it yourself. And why not? Over the past 15 years, Salesforce has redefined the CRM industry, becoming the de facto solution for managing sales, customer service, marketing automation, and analytics functions with its cloud-only approach. As Salesforce’s solutions have expanded so has their user base.
Application performance monitoring (APM) and logging both provide critical insight into your ecosystem. When paired together with context, they can provide vital clues on how to resolve problems with your applications. As the log data you analyze becomes more complex, navigating to the relevant pieces can be tricky using traditional tools. With Elastic Observability (powered by the Elastic Stack), correlating logs with APM is as simple as a few clicks in Kibana.