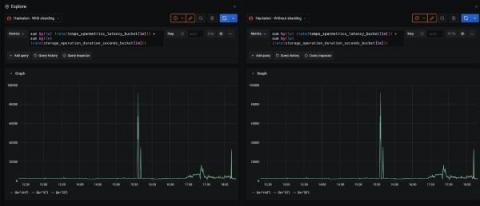
Earlier this year we introduced the world to Grafana Mimir, a highly scalable open source time series database for Prometheus. One of Mimir’s guarantees is 100% compatibility with PromQL, which it achieves by reusing the Prometheus PromQL engine. However, the execution of a query in the Prometheus PromQL engine is only performed in a single thread, so no matter how many CPU cores you throw at it, it will only ever use one core to run a single query.
When Grafana started in 2014, its main goal was to be a great dashboarding solution for Graphite. Around the same time, the Prometheus project started to gain steam, but it wasn’t clear whether it should be added to Grafana. After all, Grafana was a Graphite frontend, it was uncertain at the time if Prometheus would take off in popularity, and it would take resources away from the core purpose of why Grafana was created.
Meet the newest changemakers making an impact in the current climate crisis: Apeel Sciences. The ag-tech company is on a mission to eliminate the 8 percent of greenhouse gas emissions caused by global food waste with their edible, plant-derived food coating, which keeps fruits and vegetables fresh for up to twice as long.
For more info, go to:
Grafana Alerting page: https://grafana.com/grafana/grafana-alerting/
Grafana Alerting documentation: https://grafana.com/docs/grafana/latest/alerting/
For more info, go to:
Grafana Alerting page: https://grafana.com/grafana/grafana-alerting/
Grafana Alerting documentation: https://grafana.com/docs/grafana/latest/alerting/
For more info, go to:
Grafana Alerting page: https://grafana.com/grafana/grafana-alerting/
Grafana Alerting documentation: https://grafana.com/docs/grafana/latest/alerting/
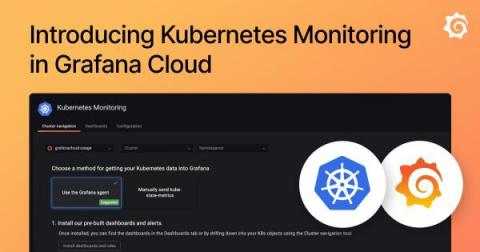
Kubernetes has quickly become the standard container orchestration technology for developers and companies who want to deploy at scale, iterate quickly, and manage a large number of applications and services. At Grafana Labs, we recognized the need for something more powerful for our users to be able to successfully keep an eye on everything happening inside their clusters.
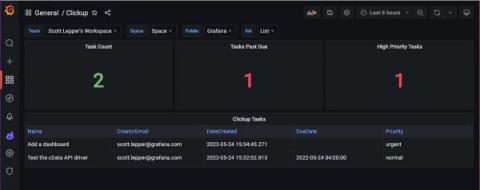
A few months ago, I wrote about using the Sqlyze data source plugin in Grafana to query COVID-19 wastewater surveillance data on Databricks. Did you know that with the Sqlyze Enterprise plugin, you can also access REST APIs (web services), treat them as database tables, and query them using SQL? You can use any ODBC driver you like, and it’s not limited to relational databases, either. You can query NoSQL and document databases, too.