Operations | Monitoring | ITSM | DevOps | Cloud
Grafana
ObservabilityCON 2023: Major news announcements, product releases, and more!
During the opening keynote of ObservabilityCON 2023 in London, we announced a range of new updates to make it easier and faster for the open source observability community to get started and scale their observability stacks.
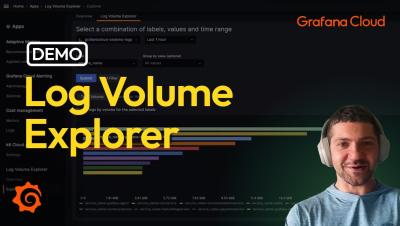
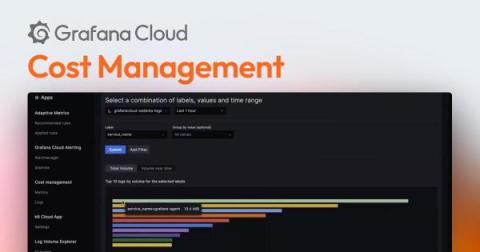
Manage log volumes, metrics cardinality, monthly bills: Explore Grafana Cloud cost management tools
As more organizations adopt observability at massive scale, they have also been grappling with rising costs. Over the past 12 months, we have been working on different solutions to help our users better understand and manage their observability stack, not to mention the bills that come with scaling it.
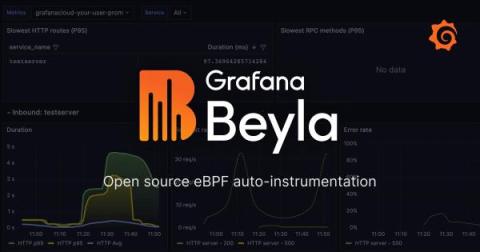
Grafana Beyla 1.0 release: zero-code instrumentation for application telemetry using eBPF
Just two months after introducing the public preview of Grafana Beyla, we are excited to announce the general availability of the open source project with the release of Grafana Beyla 1.0 at ObservabilityCON 2023 today. We’ve worked hard in the last two months to stabilize, stress test, and refine the features that were part of the public preview of this open source eBPF auto-instrumentation tool.
How Asserts.ai will make it even easier for Grafana Cloud users to understand their observability data
At Grafana Labs, our mission has always been to help our users and customers understand the behavior of their applications and services. Over the past two years, the biggest needs we’ve heard from our customers have been to make it easier to understand their observability data, to extend observability into the application layer, and to get deeper, contextualized analytics.
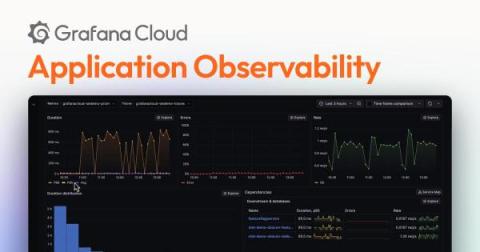
Announcing Application Observability in Grafana Cloud, with native support for OpenTelemetry and Prometheus
The Grafana LGTM Stack (Loki for logs, Grafana for visualization, Tempo for traces, and Mimir for metrics) offers the freedom and flexibility for monitoring application performance. But we’ve also heard from many of our users and customers that you need a solution that makes it easier and faster to get started with application monitoring.
Grafana k6 for Beginners: Why observability needs testing
Load testing on Kubernetes with k6 Private Load Zones (Grafana Office Hours #19)
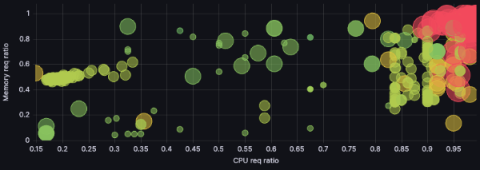
How Grafana Labs switched to Karpenter to reduce costs and complexities in Amazon EKS
At Grafana Labs we meet our users where they are. We run our services in every major cloud provider, so they can have what they need, where they need it. But of course, different providers offer different services — and different challenges. When we first landed on AWS in 2022 and began using Amazon Elastic Kubernetes Service (Amazon EKS), we went with Cluster Autoscaler (CA) as our autoscaling tool of choice.


