Operations | Monitoring | ITSM | DevOps | Cloud

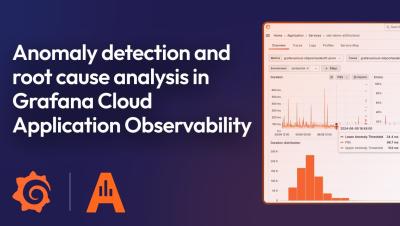
Improved anomaly detection and faster root cause analysis: the latest features in Grafana Cloud Application Observability

In recent years, “the biggest needs we’ve heard from our customers have been to make it easier to understand their observability data, to extend observability into the application layer, and to get deeper, contextualized analytics,” said Tom Wilkie, CTO of Grafana Labs, at ObservabilityCON 2023.

Anomaly detection and root cause analysis with Application Observability | Grafana Cloud

In this video, we walk you through the latest features of Grafana Cloud Application Observability, designed to accelerate anomaly detection and root cause analysis. Application Observability offers an out-of-the-box solution for monitoring applications and minimizing MTTR. It natively supports both OpenTelemetry and Prometheus and allows you to seamlessly unify application and infrastructure insights.

Grafana update: Service account tokens are replacing API keys

Enhancing security and providing flexible access control has always been part of our core mission at Grafana. In line with those efforts, we made service accounts generally available in Grafana 9.1. Service accounts are essentially machines simulating Grafana users, and they are used to run automated workloads — for example, counting the number of data sources in Grafana every day or provisioning alerts using Terraform.

Mobile app observability with OpenTelemetry, Embrace, and Grafana Cloud

We are excited to announce an expansion of our partnership with Embrace to bring mobile observability to our users using open standards like OpenTelemetry. We first worked with Embrace last year when they created a plugin for Grafana that gives mobile teams an easy way to visualize and analyze real-time mobile metrics directly in a Grafana dashboard.

How to Scale and Standardize Observability Practices: Hear from Canva and Atlassian | Grafana

This panel discussion, featuring Jenna, Director of Engineering, Reliability Platforms at Canva and Andrew, Head of Engineering at Atlassian, explored the challenges and strategies of implementing standardization in large tech companies. Atlassian, known for its software development and collaboration tools, initially faced resistance to standardization but shifted as inefficiencies and compliance issues emerged. Canva, a graphic design platform, highlighted the balance between flexibility and standardization, using observability tools for accountability.

A guide to Grafana OnCall SMS and call routing

Many organizations use incident response setups that enable them to page on-call personnel via calling or sending a message to a phone number. In this guide, you will learn how to configure such a system by using Grafana OnCall. For practical purposes, we’ll pair it with Twilio, though the same basic workflow should be applicable to other platforms. We will start with a basic setup that uses a phone number in Twilio to both call and send SMS messages to a webhook integration in Grafana OnCall.

How to Scale Observability with Grafana, Tempo, Loki, and Prometheus | Dojo | Grafana

In this talk, Roberto, a staff engineer at Dojo, outlines the company's journey toward achieving advanced observability, which has been crucial for their reliability efforts over the past three years. Dojo, a payments provider in the UK, has focused on evolving their observability practices, initially starting with basic monitoring and progressing towards comprehensive observability, encompassing metrics, traces, and logs.