Operations | Monitoring | ITSM | DevOps | Cloud

APM

The latest News and Information on Application Performance Monitoring and related technologies.

Monitoring your Spring Boot Application using OpenTelemetry

OpenTelemetry can auto-instrument your Java Spring Boot application to capture telemetry data from a number of popular libraries and frameworks that your application might be using. It can be used to collect logs, metrics, and traces from your Spring Boot application. In this tutorial, we will integrate OpenTelemetry with a Spring Boot application for traces and logs. OpenTelemetry is a vendor-agnostic instrumentation library that is used to generate telemetry data like logs, metrics, and traces.

Understanding Flame Graphs for Visualizing Distributed Tracing

In the ever-evolving world of software development, one constant remains - the pursuit of better performance. As applications grow in complexity and demand, the need for tools to uncover performance bottlenecks becomes paramount. Flamegraphs, a brainchild of Brendan Gregg, has emerged as an important visualization of insight, showing those dark corners of your codebase that need optimization.

Smart Agent for Cisco AppDynamics is here!

Unlock business and performance insights... See how Smart Agent dramatically simplifies application instrumentation through intelligent agent automation and lifecycle management — saving you time, accessing new capabilities and gaining business context. Simplify your agent management in a few clicks... Save time and effort installing and managing agents at scale with a centralized agent management console. AppDynamics provides a complete agent inventory, managed by Smart Agent, to quickly flag and upgrade out-of-date agents to support better version compliance and reporting.

OpenTelemetry Collector - architecture and configuration guide

OpenTelemetry Collector is a stand-alone service provided by OpenTelemetry. It can be used as a telemetry-processing system with a lot of flexible configurations to collect and manage telemetry data. Let's do a deep dive on OpenTelemetry Collectors to understand how it works. The first step in setting up observability with OpenTelemetry is instrumentation. The application code is instrumented with OpenTelemetry client libraries that help generate telemetry data like logs, metrics, and traces.
Database Trends 2024: The Power of Cloud, Consumption Models, and the Popularity of PostgreSQL

A large proportion of our customers rely on eG Enterprise to monitor and troubleshoot application and end-user experience problems caused by problems in underlying database dependencies. Our end-to-end unified monitoring and root-cause analysis platform supports all major database technologies. Over recent years, we have witnessed a significant shift from traditional on-premises databases to more dynamic, scalable solutions.

Loki vs Elasticsearch - Which tool to choose for Log Analytics?

Elasticsearch, or the ELK stack, is a popular log analytics solution. The Loki project was started at Grafana Labs in 2018. Grafana leads the development of Loki, while Elastic is the company behind Elasticsearch. In this article, we will do a detailed comparison between these two tools for log analytics. Log data helps application owners debug their applications while also playing a critical role in cyber security.

Top 11 Splunk Alternatives in 2024 [Includes Free & Open-Source Tools]

Splunk is a powerful unified security and observability tool that analyzes data and logs. Splunk allows you to monitor and visualize data in real-time. It analyzes machine-generated data and logs through a web interface. It was recently acquired by Cisco in a $28 billion deal. While Splunk is a powerful platform, it might not suit your needs. In this post, we discuss 11 top Splunk alternatives that you can consider.

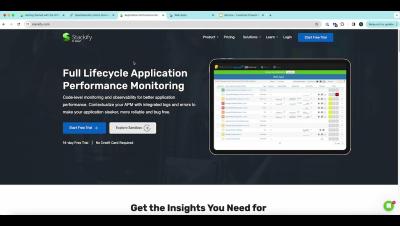
OTel Applications on Retrace

We are excited to inform you that Open Telemetry is now available for you with the introduction of “Netreo OTel Appliance”. With the OTel Appliance, cloud-native services like AWS Lambda, AWS ECS, AWS EKS, Azure Functions, Azure App Services, Azure Container Instances, and Azure Kubernetes Services can be monitored and you see application traces and logs in Retrace UI (s1.stackify.com). The applications hosted in the cloud Serverless and containers can be monitored without running the Retrace agent within the instance itself.

Kubectl Logs Tail | How to Tail Kubernetes Logs

The kubectl logs tail command is a tool that allows users to stream the logs of a pod in real-time while using Kubernetes. This command is particularly useful for debugging and monitoring applications, as it enables users to view log output as it is generated and quickly identify any issues or problems with their application. In this article, we will see how to use the kubectl logs tail command to stream logs, the benefits of using the command, and an advanced tool for streaming logs.

Kubectl Top Pod/Node | How to get & read resource utilization metrics of K8s?

Kubectl Top command can be used to retrieve snapshots of resource utilization of pods or nodes in your Kubernetes cluster. Resource utilization is an important thing to monitor for Kubernetes cluster owners. In order to monitor resource utilization, you can keep track of things like CPU, memory, and storage. In this article, we will see how to use kubectl Top command to get and read metrics about pods and nodes. We will also breakdown the output to understand what it means.