Operations | Monitoring | ITSM | DevOps | Cloud

APM

The latest News and Information on Application Performance Monitoring and related technologies.

Top 11 Splunk Alternatives in 2024 [Includes Free & Open-Source Tools]

Splunk is a powerful unified security and observability tool that analyzes data and logs. Splunk allows you to monitor and visualize data in real-time. It analyzes machine-generated data and logs through a web interface. It was recently acquired by Cisco in a $28 billion deal. While Splunk is a powerful platform, it might not suit your needs. In this post, we discuss 11 top Splunk alternatives that you can consider.

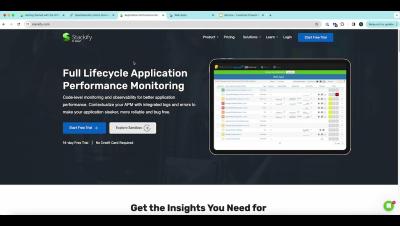
OTel Applications on Retrace

We are excited to inform you that Open Telemetry is now available for you with the introduction of “Netreo OTel Appliance”. With the OTel Appliance, cloud-native services like AWS Lambda, AWS ECS, AWS EKS, Azure Functions, Azure App Services, Azure Container Instances, and Azure Kubernetes Services can be monitored and you see application traces and logs in Retrace UI (s1.stackify.com). The applications hosted in the cloud Serverless and containers can be monitored without running the Retrace agent within the instance itself.

Kubectl Logs Tail | How to Tail Kubernetes Logs

The kubectl logs tail command is a tool that allows users to stream the logs of a pod in real-time while using Kubernetes. This command is particularly useful for debugging and monitoring applications, as it enables users to view log output as it is generated and quickly identify any issues or problems with their application. In this article, we will see how to use the kubectl logs tail command to stream logs, the benefits of using the command, and an advanced tool for streaming logs.

Kubectl Top Pod/Node | How to get & read resource utilization metrics of K8s?

Kubectl Top command can be used to retrieve snapshots of resource utilization of pods or nodes in your Kubernetes cluster. Resource utilization is an important thing to monitor for Kubernetes cluster owners. In order to monitor resource utilization, you can keep track of things like CPU, memory, and storage. In this article, we will see how to use kubectl Top command to get and read metrics about pods and nodes. We will also breakdown the output to understand what it means.

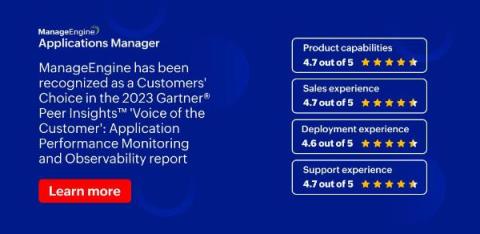
We've done it again: ManageEngine named a 2023 Gartner Peer Insights Customers' Choice for Application Performance Monitoring and Observability!

At ManageEngine, customers are at the heart of everything we do. That’s why we are excited to be recognized as a 2023 Gartner Peer Insights™ Customers’ Choice for Application Performance Monitoring and Observability. This year marks the fifth time we have been recognized with this distinction.

Decoding PostgreSQL Monitoring | 101 Guide

Monitoring PostgreSQL for performance issues is critical. PostgreSQL is a powerful open-source relational database system that stands out for its robustness, scalability, and strong emphasis on extensibility and standards compliance. In this guide on PostgreSQL monitoring, we will cover key PostgreSQL metrics that should be monitored, best practices for monitoring PostgreSQL and some tools with which you can set up PostgreSQL monitoring.

How to Monitor PostgreSQL metrics with OpenTelemetry

PostgreSQL metrics monitoring is important to ensure that PostgreSQL is performing as expected and to identify and resolve problems quickly. In this tutorial, you will install OpenTelemetry Collector to collect PostgreSQL metrics and then send the collected data to SigNoz for monitoring and visualization. In this tutorial, we cover: If you want to jump straight into implementation, start with this prerequisites section.

Swisscom breaking through internal silos with Cisco AppDynamics

Switzerland's leading telecom provider, Swisscom, managed to break through their internal silos and gain end- to-end application performance visibility. This led to on-track performance in reaching their goal of delivering 100% service quality to their customers. Understand how they did it, and which Cisco AppDynamics products they implemented to eliminate the barriers and obstacles blocking success.

Optimizing usability for evolving applications

In line with enterprise applications transitioning to the cloud, the need for simplified and efficient observability solutions is growing. AppDynamics’ cloud native response is an innovative platform designed to effortlessly onboard customer cloud environments, automate monitoring of ephemeral environments, and streamline MELT (Metrics, Events, Logs, and Traces) data correlation. By leveraging the power of data science—including machine learning and AI—it provides comprehensive solutions to challenges arising from applications, Kubernetes, infrastructure, or other cloud-native aspects in a multi-cloud world.

Datadog on Design Systems

Over the last five years, the Datadog platform has grown. We added Application Performance Monitoring to complement our core infrastructure monitoring product, Log Management, Synthetic and Real User Monitoring, and more. For an enterprise software platform to be successful, the whole has to be greater than the sum of its parts. In Datadog’s case, this means users must be able to connect different types of data, pivot seamlessly from one context to another, and follow the thread of an investigation wherever it might lead.