Operations | Monitoring | ITSM | DevOps | Cloud

APM

The latest News and Information on Application Performance Monitoring and related technologies.

Kibana vs. Grafana - A Scenario-Based Decision Guide [2024]

Both Kibana and Grafana are data visualization tools providing users capabilities to explore, analyze and visualize data with dashboards. The difference between Kibana and Grafana lies in their genesis. Kibana was built on top of the Elasticsearch stack, famous for log analysis and management. In comparison, Grafana was created mainly for metrics monitoring supporting visualization for time-series databases.

Top 14 ELK alternatives [open source included] in 2024

ELK is the acronym Elasticsearch, Logstash, and Kibana, and combined together, it is one of the most popular log analytics tools. Elastic changed the license of Elasticsearch and Kibana from the fully open Apache 2 license to a proprietary dual license. The ELK stack is also hard to manage at scale. In this article, we will discuss 14 ELK alternatives that you can consider using.

A Lightweight Open Source ELK alternative

ELK is the acronym Elasticsearch, Logstash, and Kibana, and combined, it is one of the most popular log analytics tools. Elastic changed the license of Elasticsearch and Kibana from the fully open Apache 2 license to a proprietary dual license. The ELK stack is also hard to manage at scale. SigNoz can be used as a lightweight alternative to the ELK stack.

Cisco AppDynamics for SAP in Manufacturing: an analysis of challenges and solutions

In this Cisco Cloud Observability video, Matt Schuetze delves into the complex challenges that define today's manufacturing business landscape—and how Cisco AppDynamics can integrate with SAP environments to address them. The video offers an essential understanding of the manufacturing industry’s challenges and the role SAP plays in it. Matt explains Cisco AppDynamics’ unique capability to link business process steps and flows to the underlying ABAP code and HANA database calls, providing a direct connection to user experience within the SAP environment.

Will Broadcom's plans for VMware affect you?

It is an unsettling time for many of our partners and customers, particularly those leveraging VMware technologies such as VDI and server virtualization, with uncertainty of Broadcom’s plans after their recent acquisition of VMware and likely changes to licensing costs, SKUs, product availability and so on.

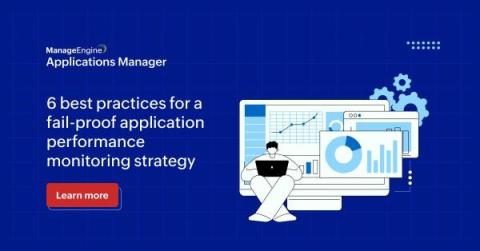
6 best practices for application performance monitoring

In today’s digital era, where applications are the lifeline of many businesses, the importance of monitoring and observing their performance is undeniable. It’s not just about keeping systems up; it’s about understanding how applications behave and ensuring they meet the ever-growing expectations of users. Let’s take a look at six best practices in application performance monitoring that organizations can implement to set themselves up for success.

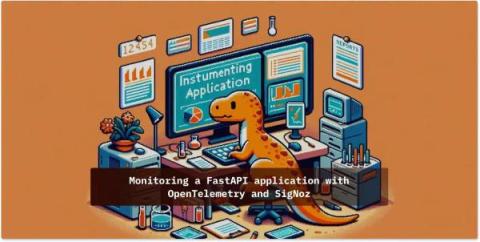
Monitoring your FastAPI application with OpenTelemetry

FastAPI is a modern Python web framework based on standard Python type hints that makes it easy to build APIs. It's a relatively new framework, having been released in 2018 but has now been adopted by big companies like Uber, Netflix, and Microsoft. Using OpenTelemetry, you can monitor your FastAPI applications for performance by collecting telemetry signals like traces. FastAPI is one of the fastest Python web frameworks currently available and is really efficient when it comes to writing code.

Improve Cloud Visibility with JFrog's SaaS Log Streamer

The beauty of deploying SaaS-based applications is that you don’t have to worry about building the infrastructure, hiring engineers to maintain it, staying on top of upgrades or worry about application security. Indeed, these are some of the main benefits you get by using a SaaS offering. However, the world of software is full of trade-offs, so, what do you lose out on?