Operations | Monitoring | ITSM | DevOps | Cloud

APM

The latest News and Information on Application Performance Monitoring and related technologies.

Dash Panel Discussion: What Users Really Want

Measuring user experience is typically done by tracking metrics like latency and purchase frequency. But these metrics can often obscure real user sentiment. In this panel session moderated by Miranda Kapin, you can learn about better ways to uncover how users are truly experiencing your application and methods for improving their engagement.

Building a Multi-Tenant Insurance Platform

In 2020, CoverWallet—a multi-tenant insurance platform—was acquired by Aon, which led to a rapid expansion in both the size and global presence of its engineering organization. In his talk, CoverWallet’s Hylke Alons walks through the changes that were necessary to meet their platform's new expectations, including improving growth and scalability while ensuring reliability, automating security, and reducing maintenance. He also discusses some best practices for scaling up engineering and product teams to handle demand in a complex and highly regulated industry like insurance.

Optimize Trace Memory with Scout

Application performance monitoring (APM) is a process of monitoring and analyzing performance issues within an application. In monolithic architecture, monitoring the performance of an application using APM tools was straightforward. However, once the application adopts microservice architecture, the application becomes more complex, and the business functionalities flow into different microservices to complete the workflow.

Kubernetes Audit Logs - Best Practices And Configuration

Kubernetes is the de facto leader of container orchestration tools. With the growing popularity of micro-service-based development, Kubernetes emerged as the go-to tool to deploy and manage large-scale enterprise applications. However, with the plethora of features offered by Kubernetes, it is a complex tool to manage and operate. This article will focus on how to configure Kubernetes Audit Logs so that you can have the records of events happening in your cluster.

17 Popular Java Frameworks for 2023: Pros, cons, and more

In 2023, Java is still the third most popular programming language in the world. It encompasses a vast ecosystem and more than 9 million Java developers worldwide. Java’s popularity comes down to a few key advantages; it’s a platform-independent language (write once, run anywhere) that follows the object-oriented programming paradigm and is straightforward to understand, write, and debug.

New Relic Alternative for Python

Python is one of the most used languages among developers. There are many reasons why python is very famous among developers, which we will discuss in this blog. Due to the fame of python, it is used in many business applications, hence monitoring a python application is crucial. New Relic is one of the oldest monitoring tools for python monitoring. But New Relic competitors are growing rapidly; hence, if you do not like the New Relic user interface, many New Relic alternatives exist.

One Click Visibility: Coralogix expands APM Capabilities to Kubernetes

There is a common painful workflow with many observability solutions. Each data type is separated into its own user interface, creating a disjointed workflow that increases cognitive load and slows down Mean Time to Diagnose (MTTD). At Coralogix, we aim to give our customers the maximum possible insights for the minimum possible effort. We’ve expanded our APM features (see documentation) to provide deep, contextual insights into applications – but we’ve done something different.

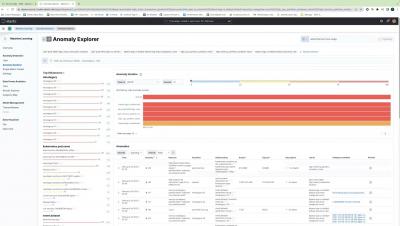
How to detect anomalies in logs, metrics, and traces to reduce MTTR with Elastic Machine Learning

Elastic Observability has extensive machine learning capabilities that support and improve analysis in APM. Learn techniques for correlating and detecting anomalies of telemetry data from APM agents for a particular application.