Learn effective strategies for navigating automation and cost management. #rivian #shorts
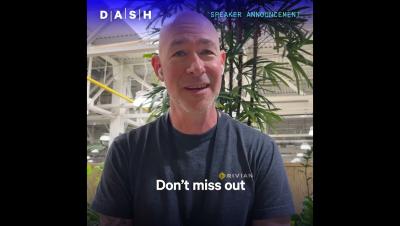
Learn effective strategies for navigating automation and cost management in connected vehicle ecosystems with Rivian's Senior Engineering Manager, Beau Christensen, at DASH 2024.