Operations | Monitoring | ITSM | DevOps | Cloud

CI CD

The latest News and Information on Continuous Integration and Development, and related technologies.

Are you on top of newly introduced errors in your CI/CD releases?

Log files are infamous for being “noisy”. Without the right management solution, trying to find a specific piece of information or using them to reproduce a critical error is a complex undertaking. If you’re working with CI/CD, how do you attribute new errors to a particular release? How do you investigate those errors and make sure that your customers aren’t being impacted? Faster releases mean shorter development and testing cycles before new code reaches production.

Track, Debug, and Fix Errors with Sleuth and Sentry

Developer teams shipping software frequently are in a constant state of change. Understanding the state of their code at a given point of time is sometimes clear as mud. The Sentry | Sleuth integration is focused on helping developers automate the annoyances of deploying software, tracking the health of a release, and providing clarity on how to resolve critical code issues.

How FireHydrant's CI/CD infrastructure fixes bugs faster

Almost everyone knows that working with third-party APIs can be challenging. Sometimes the errors happen unexpectedly. Sometimes the error information that you receive is inaccurate. While most people feel these pains acutely, I’d like to share how we answer these challenges at FireHydrant and how it’s helped us avoid headaches and stress.

Integrating Sensu Go into your CI/CD pipeline with sensuctl prune

Since the release of Sensu Go, many in our community have told us Sensu is easier and faster to deploy, more portable, and more compatible with containerized and ephemeral environments (as compared to Sensu Core, the original version of Sensu). In a recent webinar, I talked about integrating Sensu Go with your CI/CD pipeline and how to use the sensuctl prune command to keep your Sensu resources in a declarative state, reducing dependence on traditional configuration management tools.

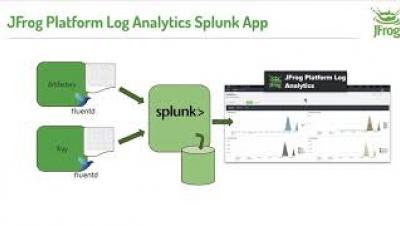
JFrog Platform Log Analytics Splunk App

The Splunk App for JFrog Platform Log Analytics processes extracted log data for the JFrog Platform, the universal, hybrid end-to-end DevOps platform. The app provides a set of operations diagnostic dashboard views for JFrog Artifactory and JFrog Xray error tracking. Learn how the Splunk app works, with some demonstration of its use.

Simplify License Compliance

Today managing your licenses with Cloudsmith has become incredibly simple. Now, with the help of our License Compliance UI, not only can you update the license associated with a package without needing to modify a package, plus you can also view statistics of how your overall licenses appear across all packages within a repository. Don't believe me?

DevOps 101 - Introduction to CI/CD

When you’re new to an industry, you encounter a lot of new concepts. We tend to use a lot of jargon, the documentation may be written with someone more experienced in mind or rely on contextual knowledge of the rest of the space, and it often doesn’t explain the “why” for the tool. This can make it really difficult to get your feet underneath you on an unfamiliar landscape, especially for junior engineers.