Kubernetes Master Class - OPA in Rancher 2.4 - 2020-04-27
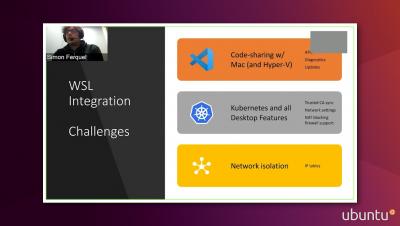
This is the Kubernetes Master Class from April 27, 2020, where we discussed how to use the Open Policy Agent features present in Rancher 2.4.


The latest News and Information on Containers, Kubernetes, Docker and related technologies.
Editor's note: This blog is part two of our series on launching an app to AWS. For the first installment, "How to deploy an app to AWS: Getting started," click here. So, your application is ready for production. You’ve taken an inventory of your applications, dependencies, and configuration. Now, you’re ready to create a new AWS account and start launching resources.
“With sustainability our primary focus, our technology strategy has to mirror our overall approach. With Rancher we’re driving real transformation to prime us for long-term growth.” – Zach Dunn, Senior Director of Platform Operations and CSO, Optoro. Have you ever considered what happens to items you return to etailers? In retail, especially ecommerce, nearly 25 percent of all goods are returned or don’t sell.
Kubernetes adoption comes with a lot of challenges. One of them is consistently deploying applications to the platform. GitOps is a strategy which solves this problem and solves it at scale. In this blog, we will share how to leverage TravisCI and ArgoCD to design a highly scalable production-ready CI/CD workflow.
If you’re in enterprise IT, you’ve probably already looked into Microsoft’s Azure public cloud. Microsoft Azure offers excellent enterprise-grade features and tightly integrates with Office 365 and Active Directory. It also provides a managed Kubernetes service, AKS, that you can provision from the Azure portal.
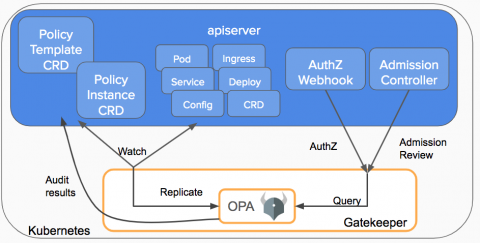
In this blog post, we’re going to explain how to monitor Open Policy Agent (OPA) Gatekeeper with Prometheus metrics. If you have deployed OPA Gatekeeper, monitoring this admission controller is as relevant as monitoring the rest of the Kubernetes control plane components, like APIserver, kubelet or controller-manager. If something breaks here, Kubernetes won’t deploy new pods in your cluster; and if it’s slow, your cluster scale performance will degrade.
When is the last time you repaid a friend in cash for a shared expense? More likely, you used your phone and a handy app to pay your share. We’ve come to expect fast, secure and reliable technologies that let us make payments to anyone, anywhere from our mobile devices. So who is behind this technology?
COVID-19 has led businesses into extreme work challenges. To overcome these challenges, companies have shifted their working patterns and have embraced Remote Work to avoid any negative impact on employee’s health as well as the business. COVID-19 has made IT-sector office culture’s shift to remote work prominently. The tech teams, who already have DevOps processes in place, got huge benefits and did not get much impact while shifting their workplace from regular office to home.