Grafana Alerting: A beginner's guide to templating alert notifications

We often see questions about how to template alerts. In Grafana, you can template information about your alerts with custom labels and annotations, and you can also template how notifications look and what information they contain with notification templates. Many users confuse the two, despite being separate features with different use cases.

MetricFire - Dashboards Tutorial

In this video, we explore MetricFire’s powerful dashboarding platform. Discover how to customize your dashboard to view the metrics that matter most to your business. With a variety of visualization options and an intuitive interface, creating and editing charts, tables, and graphs has never been easier. Share your dashboard with your team and keep everyone on the same page. Join MetricFire and start tracking your business metrics today.

Frontend vs. backend: How to plan your performance testing strategy

There are many aspects of application performance, but they broadly fall into two categories: frontend performance and backend performance. As a tester, it’s important to know the differences between the two and how that impacts the way you approach your tests. In this blog, I’ll provide a high-level overview of frontend performance testing and backend performance testing, including pros and cons of each one.

Splunk Dashboard Studio Demo in Splunk 9.0

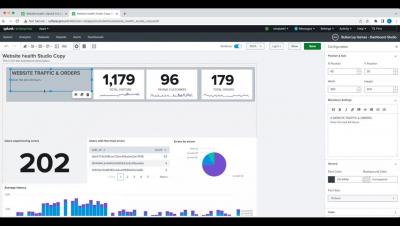
Splunk Dashboard Studio is our new and intuitive dashboard-building experience that allows you to communicate even your most complex data stories. This demo walks you through how to convert an existing Classic Simple XML dashboard to Dashboard Studio and how to leverage Splunk Dashboard Studio to more effectively communicate the data in your dashboard. Follow along to learn about the key capabilities to leverage when building dashboards in Splunk, including how to edit the source code to apply default configurations to multiple objects at once, how to use the configuration panel to easily edit objects, and more tips and tricks to group and stylize your visualizations.

Reduce compliance TCO by using Grafana Loki for non-SIEM logs

Compliance is a term commonly associated with heavily regulated industries such as finance, healthcare, and telecommunication. But in reality, it touches nearly every business today as governments and other regulatory agencies seek to enact tighter controls over the use of our collective digital footprint. As a result, more and more companies need to retain a record of every single digital transaction under their control.

A year in Mimir: Massive scale, new metrics formats, increased adoption

When we introduced Grafana Mimir into the open source ecosystem, we weren’t shy about our ambitions. Once we got past answering some of the easier questions (For the record, the name Mimir comes from Norse mythology, and it’s pronounced /mɪ’mir/.), we quickly got to work making good on our promise to deliver the most scalable, most performant open source time series database (TSDB) in the world.

How Geometric Search Works for Hexagons in Elasticsearch

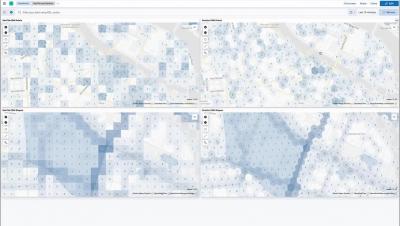
Geographic grid systems allow zooming into maps at progressively higher resolutions and finer grids. For rectangular grids, this is very simple, but for hexagonal grids, the situation is much more complex, since child hexagons are not fully contained within parent hexagons. This video demonstrates how we can still achieve efficient parent-child search in Elasticsearch using the H3 hexagonal grid.