Operations | Monitoring | ITSM | DevOps | Cloud

PHP monitoring with Datadog APM and distributed tracing

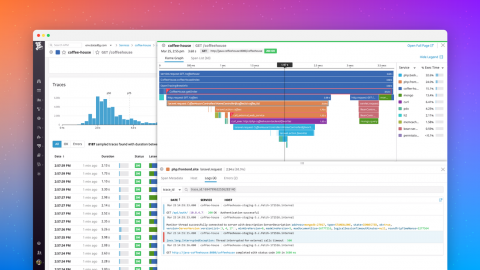
Since its release in 1995, PHP has been one of the most popular server-side languages for building web applications. It supports a wide range of web servers, databases, and operating systems. PHP developers use popular frameworks like Laravel, Symfony, and Zend to deploy and manage sites that serve high volumes of traffic. To help you monitor PHP performance, identify bottlenecks, and optimize your users’ experience, we’re pleased to announce APM & distributed tracing for PHP.

Key ECS metrics to monitor

Amazon Elastic Container Service (ECS) is an orchestration service for Docker containers running within the Amazon Web Services (AWS) cloud. You can declare the components of a container-based infrastructure, and ECS will deploy, maintain, and remove those components automatically. The resulting ECS cluster lends itself to a microservice architecture where containers are scaled and scheduled based on need.

Tools for ECS monitoring

In Part 1, we introduced a number of key metrics that you can use for ECS monitoring. Monitoring ECS involves paying attention to two levels of abstraction: the status of your services, tasks, and containers, as well as the resource use from the underlying compute and storage infrastructure, monitored per EC2 host or Docker container. In this post, we’ll survey some techniques you can use to monitor both levels of your ECS deployment.

Monitoring ECS with Datadog

As we explained in Part 1, it’s important to monitor task status and resource use at the level of ECS constructs like clusters and services, while also paying attention to what’s taking place within each host or container. In this post, we’ll show you how Datadog can help you: Automatically collect metrics from every layer of your ECS deployment, Track data from your ECS cluster, plus its hosts and running services in dashboards, and more.

Performance monitoring with OpenTracing, OpenCensus, and OpenMetrics

If you are familiar with instrumenting applications, you may have heard of OpenMetrics, OpenTracing, and OpenCensus. These projects aim to create standards for application performance monitoring and collecting metric data. Although the projects do overlap in terms of their goals, they each take a different approach to observability and instrumentation.

2018 year in review

There were some big IT headlines this past year. Microsoft acquired GitHub and IBM bought Red Hat. Kubernetes graduated from the CNCF incubator program. And the biggest headline of all—at least to those of us at Datadog, where we live and breathe monitoring—we released Datadog Agent version 6, a completely new monitoring agent written in Go! As we start the new year, we’d like to take a moment to recognize some of the incredible things our engineers accomplished in 2018.