Operations | Monitoring | ITSM | DevOps | Cloud

The latest News and Information on Monitoring for Websites, Applications, APIs, Infrastructure, and other technologies.

On Release Days We Wear Teal for release 4.19.1

In this episode, Leon explores some of the new features, functions, updates, and improvements in release 4.19.1, which includes private links, setting a region per workspace, choosing a release channel per workspace, and a look at Output Routers, an incredibly useful (but unfortunately under-loved) feature that’s been around for a hot minute.

Multi-Agent Orchestration for SRE: AURA Runs a Model per Specialist

Give one agent every tool and every incident is a question of trust. This one hands each job to a worker that can only reach what that job needs. One AURA configuration defines a coordinator and three specialist workers. Qdrant stores the runbooks, Prometheus measures workload health, and Kubernetes provides inspection and remediation, and each of the three is wired to one worker.

When to Use Grafana Assistant vs. MCP vs. GCX: Part 2

When should you reach for Grafana MCP? It’s one of the two “hands” in Grafana’s AI toolkit — and the easy one at that. MCP lets you bring Grafana into the tools you already use, like ChatGPT, Claude, or Cursor, without changing your workflow. No terminal? MCP. Want to stick with your favorite AI tool? MCP. Want easy tool discovery out of the box? MCP. Here’s where it fits, and when to use it — explained by Nicole van der Hoeven.

7 lessons for IT leaders on using observability to monitor AI applications

What it takes to prove AI value with LLM observability Over six months, the Elastic IT team ran internal AI applications that returned $2.5 million in operational time to the business.1 A conversational support assistant moved us from zero digital resolution, where anything complex became a ticket, to 30% of support interactions closing without one.

A Guide to Downsampling Time Series Data with InfluxDB 3

Summary Downsampling turns high-frequency time series data into lower-resolution summaries. In InfluxDB 3, you can calculate those summaries by querying with SQL or materialize them on a schedule with the Python Processing Engine. Table of Contents This tutorial demonstrates both approaches using the InfluxDB 3 Processing Engine’s built-in bird tracking simulator plugin. You will generate telemetry, aggregate it into 10-second windows, and validate the result with SQL.

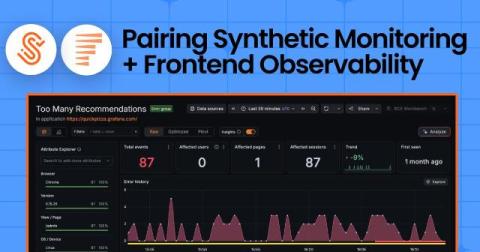
From failed check to real user impact: Pairing Synthetic Monitoring and Frontend Observability in Grafana Cloud

Say you get a support escalation about a page in the app that won’t load. But when you pull up your synthetic checks, they're all green: 100% uptime, probes are passing. Something's not adding up, but which one do you trust? If you’ve run Grafana Cloud Synthetic Monitoring, you’ve been on both sides of this. Sometimes it's the ticket: real users hit a wall on the path but your checks pass cleanly. Other times, it’s the inverse.

Knowledge Graph as context for LLMs: demonstrating decisive RCA and faster production performance

On the product team here at Grafana Labs, we consider AI agents our users, too. That’s why we set out to test how well agents can debug incidents across the full stack, and how much better they perform with Grafana Cloud’s Knowledge Graph vs. using raw telemetry alone. Our early results are promising. In one real incident we replayed 16 times each way, an agent with Knowledge Graph context found the correct root cause 15 times, compared with just once using raw telemetry alone.

Meet the official UptimeRobot CLI.

Managing monitors has meant one of two things: the dashboard, or writing your own API calls. There is now a third. The official UptimeRobot CLI is live on npm, and it drives every monitor, incident, and status page in your account from the shell you already have open. It is free, open source under Apache 2.0, and works on every plan including the free one.