Operations | Monitoring | ITSM | DevOps | Cloud

The latest News and Information on Monitoring for Websites, Applications, APIs, Infrastructure, and other technologies.

Netreo Full-Stack Monitoring and Observability Suite Achieves Veracode Verified Standard Recognition

Netreo, the award-winning provider of IT infrastructure monitoring and observability solutions and one of Inc. 5000’s fastest growing companies, today announced that the Netreo full-stack IT infrastructure monitoring and Retrace by Netreo full lifecycle APM solutions have both earned Veracode Verified Standard recognition for proven security practices in application development.

Top Dashboards For Remote Digital Employee Experience Monitoring

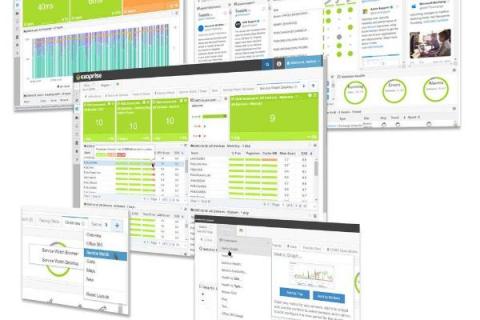
Your business is already operating in a hybrid model, isn’t it? Perhaps, you are deciding to become an entirely remote workforce. Whatever be the case, IT must support employees working from multiple locations and track remote digital employee experiences using real-time dashboards. In this article, we are going to cover three Digital Experience Monitoring dashboards to help your team identity and troubleshoot problems that your employees might face in their home environment.

How Automated Application Monitoring Saves Time and Money

With the increase in demand for technology and quality assurance, companies are looking to improve their products day by day. For many, time and workforce are limited, so companies are interested in solutions that automate their day-to-day work. Whether developing software or testing it, almost every part of application lifecycle management is reliable on the human workforce. But some parts like monitoring, tracking, and alerting can be automated using some latest software.

Top 5 user-requested synthetic monitoring alerts in Grafana Cloud

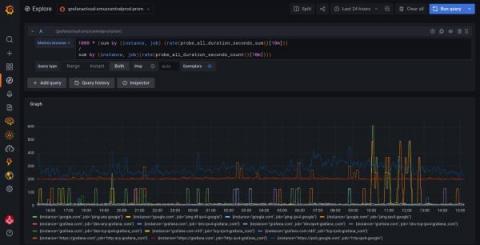
We often hear from Grafana Cloud users who are asking for guidelines on how to write better alerts on synthetic monitoring metrics and get notified when synthetic monitoring detects a problem. We already ship a predefined alert in Grafana Cloud synthetic monitoring. A predefined alert that we ship is alerting on the probe_all_success_sum metric and makes use of the alert sensitivity config to create multiple Grafana Cloud alerting rules. Check out synthetic monitoring alerting docs for details.

Comparing REST and GraphQL Monitoring Techniques

Maintaining an endpoint, especially a customer-facing one, requires constant monitoring, whether using REST or GraphQL. As the industry has looked for solutions to build a more adaptive endpoint technology, it is also a must to monitor these endpoints. GraphQL and REST are two different technologies that allow user-facing clients to link to databases and platform logic. Both GraphQL and REST include monitoring techniques.

Data Federation and the Modern Enterprise

In our increasingly hyper-connected, data-dependent world, it can be difficult to keep track of where resources are, how to access them, and how to put data assets to work to run a more efficient and reliable enterprise. Traditional approaches to IT operations analytics are becoming outmoded as the sources and types of data grow more mobile, ephemeral, diverse and distributed.

How to measure the performance of a website

If you’re a person who works from home, you almost certainly have to deal with occasional internet connection issues. More often than complete outages, you’re likely dealing with occasional slowness. And you know from experience that any one of dozens of devices and services along the path can cause latency.

Why cloud native requires a holistic approach to security and observability

Like any great technology, the interest in and adoption of Kubernetes (an excellent way to orchestrate your workloads, by the way) took off as cloud native and containerization grew in popularity. With that came a lot of confusion. Everyone was using Kubernetes to move their workloads, but as they went through their journey to deployment, they weren’t thinking about security until they got to production.

Configure Cribl LogStream to Avoid Data Loss With Persistent Queuing

Preventing data loss for data in motion is a challenge that LogStream Persistent Queues (PQ) can help prevent when the downstream Destination is unreachable. In this blog post, we’ll talk about how to configure and calculate PQ sizing to avoid disruption while the Destination is unreachable for few minutes or a few hours. The example follows a real-world architecture, in which we have.