Operations | Monitoring | ITSM | DevOps | Cloud


The latest News and Information on Monitoring for Websites, Applications, APIs, Infrastructure, and other technologies.

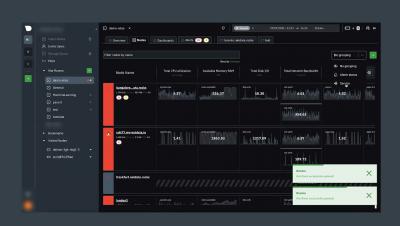
Netdata's Nodes view for troubleshooting system health and performance

What is Synthetic Monitoring?
Synthetic monitoring is automated testing of critical business transactions and user experiences. Synthetic monitoring helps businesses find, fix and prevent availability issues, performance issues and 3rd party vendors from giving you an insight into performance improvements that you can make to your website and supply chain to improve conversions and user happiness. Synthetic monitoring is also sometimes called user journey monitoring.

The Opportunity for Observability

Do You Know What's Keeping Your Cloud Team up at Night?
Cloud teams are busy. In fact, Virtana’s recently published State of Hybrid Cloud and FinOps survey found that 44% of respondents have deployed more than half of their workloads in a public cloud, and 88% have deployed more than one-quarter of their workloads in a public cloud. That’s a lot of migration, optimization, and management on the cloud team’s plate; and it’s not just for right now but for the foreseeable future.
Retrace vs Microsoft Application Insights - 14 Reasons to Choose Retrace
You are in the right place! Retrace APM is designed to help developers optimize the performance of their applications and is an excellent Application Insights alternative.

The Benefits of Structuring Logs in a Standardized Format
Image via Pixabay As any developer or IT professional will tell you, when systems experience issues, logs are often invaluable. When implemented and leveraged effectively, the data produced by logging can assist DevOps teams in more quickly identifying occurrences of problems within a system. Moreover, they can prove helpful in enabling incident responders to isolate the root cause of the problem efficiently. With that being the case, maximizing the value of log data is vital.
Azure, Microsoft 365, and the Monitoring Story
Learn how to make the Azure Monitor a valuable tool to monitor your Microsoft 365 subscription, including services such as Exchange, SharePoint, Teams, OneDrive, and more. See how the Metric Explorer in Azure Monitor will work for you, including addressing custom metrics quickly. Understand how to display Log Analytics metric data in PowerBI Reports and Azure Monitor Workbooks. Join this educative and fun session about Azure and Microsoft 365, united into one magnificent monitoring solution.

Monitor your CircleCI environment with Datadog
Datadog CI Visibility provides a unified platform for monitoring your CI/CD pipelines. Now, we are partnering with CircleCI to extend that same critical visibility to your CircleCI environment. Datadog’s integration uses CircleCI webhooks to capture information about the status and performance of your workflows and associated jobs, such as a job’s duration and whether or not it failed or was canceled.