In this guide, we’ll walk you through the Prometheus rate function. You’ll discover how to analyze changes over time and use that information to enhance your monitoring strategy.
We consistently roll out helpful updates and fun features in Grafana Cloud, our fully managed observability platform powered by the open source Grafana LGTM Stack (Loki for logs, Grafana for visualization, Tempo for traces, and Mimir for metrics). And this month, on the heels of ObservabilityCON 2024 — our flagship observability event — we have no shortage of updates to share.
OpenTelemetry, OTel, is an incredible open-source observability framework that helps you collect, process, and export trace data. It's super valuable for engineers who want to understand their systems better. At the heart of this framework lies the OpenTelemetry Collector, a pivotal component that turns raw traces into useful metrics. Let’s explore the importance of the OpenTelemetry Collector and show you how it makes it easier for engineers to make sense of data.
The ethos – and existential urgency – driving “responsible AI” policies is rooted in themes such as privacy, security, fairness, and transparency. Many headlines blur AI concepts such as machine learning, adaptive algorithms, deep learning, natural language processing, and generative AI (GenAI) technologies that are driving the current AI boom. People are worried about their data being misused, their words misconstrued, and their work misrepresented.
Handling real-time data at scale? Apache Kafka is likely at the heart of your system. It’s robust, fast, and highly reliable. But as Kafka clusters grow, so does the complexity of maintaining balanced workloads across brokers and partitions. Without a solid strategy for distributing that load, you’re likely to run into bottlenecks, resource exhaustion, and consumer lag—none of which are fun to deal with. So, how do you keep your Kafka setup running efficiently and smoothly?
Visibility into email health and performance is indispensable to any organization seeking to reach its customers through their inboxes. As they work to curtail spam, internet service providers (ISPs) are redefining the standards of deliverability on an ongoing basis, and organizations often struggle to adapt.
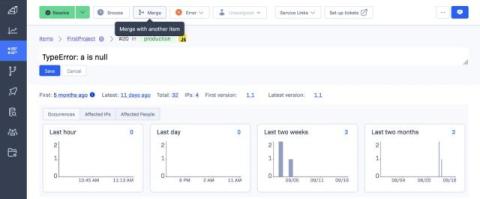
We are excited to release a new feature that will make it easier to group your items, reduce noise, and simplify your error management directly from the Item Detail page header. While you are investigating an item,, you can now search for other items within the same project and environment and merge right from that page without having to navigate back to the Item List page.
In a world where attention spans are shorter than a TikTok, the last thing a company needs is a sluggish website. 53% of people will leave a mobile page if it takes longer than 3 seconds to load. Yet, despite this, many businesses—hotels included—are still sleeping on the importance of web performance. Marriott, one of the biggest names in hospitality, might just be learning this lesson the hard way. Could their lagging website be contributing to their recent stock stumble?
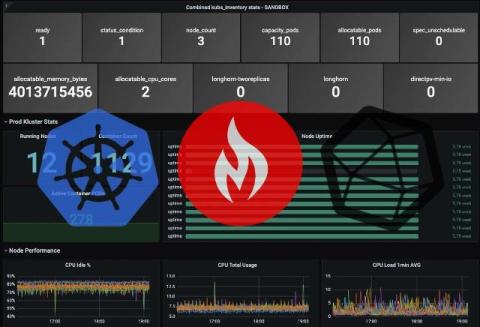
Having insights into your Kubernetes environment is crucial for ensuring optimal resource allocation and preventing potential performance bottlenecks. It also enables proactive monitoring of application health and security, helping to quickly identify and resolve issues before they impact users.
The Generative Artificial Intelligence (GenAI) innovations and advancements over the past 1.5 years have been unmatched. Gartner predicts that by 2026, more than 80% of enterprises will have deployed GenAI-enabled applications in production environments and/or used GenAI application programming interfaces or models. This is up from less than 5% in 2023.