Operations | Monitoring | ITSM | DevOps | Cloud

The latest News and Information on Monitoring for Websites, Applications, APIs, Infrastructure, and other technologies.

Where did all my Claude Code tokens go?

Most teams judge their AI coding agent on two things: the monthly bill and a feeling. The bill tells you what you spent and the feeling tells you whether it seems to be helping, but neither one tells you what the agent actually did. As these tools move into the critical path of how software ships, that gap is starting to matter. I wanted to replace the feeling with something I could measure and understand what shapes of work affects this bill, so I decided to run an experiment on myself.

How we saved over $3 million in idle compute costs with Datadog Kubernetes Autoscaling

At Datadog, our broad Kubernetes footprint amplifies the significance of a familiar autoscaling tradeoff: Overprovisioning wastes cloud spend, while underprovisioning threatens reliability. We built Datadog Kubernetes Autoscaling (DKA) to help teams rightsize their workloads by generating intelligent resource recommendations and automating multidimensional workload scaling. Across Datadog, adopting DKA has eliminated more than $3 million in annualized idle compute costs while reducing reliability risks.

Getting started with Microsoft Defender dashboards

Microsoft Defender does a great job protecting you and your organization from online threats. It is constantly working to detect and collect security data so you don’t have to worry about falling behind on incidents and vulnerabilities. The Defender portal can also provide great insights into that data, but connecting it to the rest of your stack is difficult.

The End of Self-Service IT as We Know It

The modern service desk is not short on entry points. In fact, employees can open a portal, search a knowledge base, start a chatbot conversation, or submit a ticket from almost anywhere. In theory, that should mean fewer queues and faster resolution. But if access to IT has improved so dramatically, why has the operational burden behind each interaction barely moved?

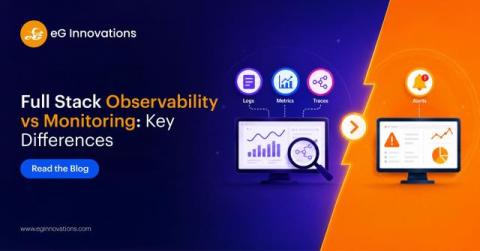
Full Stack Observability vs Monitoring: Key Differences

Traditional monitoring tracks system health by collecting data such as metrics and logs, this data is checked to see if a system is behaving as expected and alerts are raised if errors or anomalous data values are found. This works well in stable, predictable environments, but modern IT systems are far more complex and dynamic. In distributed architectures like microservices and cloud-native platforms, predefined alerts usually aren’t enough to explain why a failure is happening.

What is AIOps? Benefits, Use Cases, and How It Transforms IT Operations

Decades ago, IT operations was relatively simple, with a few components such as client, server, network, and the static environments. IT teams relied on manual analysis to manage these systems. Over time, however, IT operations has evolved significantly, driving the adoption of AIOps technologies.

Sentry 201: Integrations & Sampling That Won't Surprise You

You set up Sentry. Errors are flowing in. You'd call it instrumented. We'd call it a start. When something breaks, you should know what failed, which commit caused it, who owns it, and what the user saw — without jumping between tools or getting surprised by your bill. Most teams are closer to that than they think. This is the 201 session for teams who got Sentry firing events and stopped there.

Replacing Your Legacy Monitoring Platform? Start with a Plan.

Whether you're using SolarWinds, PRTG, Datadog, or another long-standing monitoring solution, chances are your environment has evolved significantly since the platform was first deployed. New applications have been added. Infrastructure has expanded into cloud environments. Teams have developed custom dashboards, reports, alerts, and workflows. Over time, monitoring becomes deeply woven into daily operations. That's why many organizations continue using tools that no longer meet their needs.

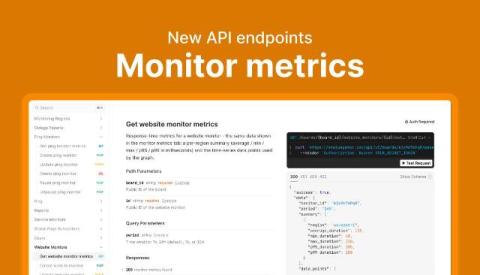
Monitor metrics now available in the v3 API

Monitor metrics are now available through the StatusGator v3 API for both Website Monitors and Ping Monitors. These endpoints provide the same latency and performance data available in the Monitor Metrics tab, making it accessible through the API and MCP server. You can find the endpoints in the API documentation.