Operations | Monitoring | ITSM | DevOps | Cloud

The latest News and Information on Monitoring for Websites, Applications, APIs, Infrastructure, and other technologies.

Optimize your CI/CD Pipeline with Coralogix Tagging

Continuous Integration/Continuous Delivery (CI/CD) has now become the de-facto standard for all engineering teams seeking to keep pace with the demands of the modern economy. At Coralogix, we operate some of the most advanced build and deploy pipelines in the world. We’ve baked that knowledge into our platform with a CI/CD Observability feature called Coralogix Tagging.

The Three Pillars of Observability: Metrics, Logs and Traces

Metrics, Logs and Traces are often referred to as The Three Pillars of “Observability“. The term observability has been used in control theory to refer to how the state of a system can be inferred from the system’s external outputs. Applied to IT, observability is how the current state of an application can be assessed based on the data it generates. Applications and the IT components they use provide outputs in the form of metrics, events, logs and traces (MELT).

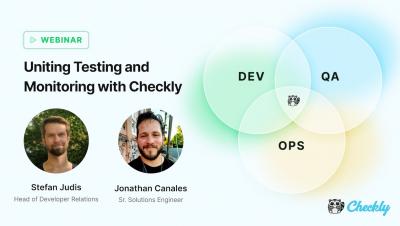
Unite Testing and Monitoring with a Monitoring as Code Workflow, Enabled by the Checkly CLI

Siloing testing and monitoring is increasing your costs, wasting Dev and QA hours, and impacting your customer's experiences. Stefan Judis and Jonathan Canales explain how to align your QA, Dev, and Ops by enabling teams to code, test, and deploy API and Playwright-based checks with our monitoring as code (MaC) workflow, enabled by the Checkly CLI.

Lightstep from ServiceNow deepens commitment to OpenTelemetry project

At Lightstep, we’ve seen many organizations grapple with “cloud-native sticker shock” as they come to understand that these complex systems require sifting through massive amounts of data across architectures and proprietary solutions. In today’s macroeconomic environment, organizations are looking to reduce costs while driving innovation, especially when it comes to cloud-native applications.

Elastic Common Schema and OpenTelemetry - A path to better observability and security with no vendor lock-in

At KubeCon Europe, it was announced that Elastic Common Schema (ECS) has been accepted by OpenTelemetry (OTel) as a contribution to the project. The goal is to achieve convergence of ECS and OpenTelemetry’s Semantic Conventions (SemConv) into a single open schema that is maintained by OpenTelemetry. This FAQ details Elastic’s contribution of Elastic Common Schema to OpenTelemetry, how it will help drive the industry to a common schema, and its impact on observability and security.

Increasing Implications: Adding Security Analysis to Kubernetes 360 Platform

A quick look at headlines emanating from this year’s sold out KubeCon + CloudNativeCon Europe underlines the fact that Kubernetes security has risen to the fore among practitioners and vendors alike. As is typically the case with our favorite technologies, we’ve reached that point where people are determined to ensure security measures aren’t “tacked on after the fact” as related to the wildly-popular container orchestration system.

DevOps Pulse 2023: Increased MTTR and Cloud Complexity

Evolving DevOps maturity, mounting Mean-Time-to-Recovery (MTTR), and perplexing cloud environments – all these factors are shaping modern observability practices according to approximately 500 observability practitioners. While every organization faces its unique challenges, there are broadly impactful trends that arise.

Grafana Cloud is now available in AWS Marketplace

Grafana Labs is excited to announce that Grafana Cloud is now available in AWS Marketplace. With this new offering, existing AWS customers can procure, deploy, and scale the fully managed Grafana LGTM observability stack (Loki for logs, Grafana for visualization, Tempo for traces, Mimir for Prometheus metrics) with just a few clicks.

The Biggest Website Outages of All Time

As much as we all love the internet and everything it offers, we’ve also all experienced that sinking feeling when we try to access our favorite website, only to find it’s down. If you run your own site, you know that uptime is crucial for your online success — so that sinking feeling in your chest when your own website is down is … well, even worse. But let’s face it: even the internet giants aren’t immune to outages.

Optimize Your Prisma Queries with AppSignal and OpenTelemetry

AppSignal integrates seamlessly with Prisma via OpenTelemetry to give you invaluable insights into how your application is performing. In this blog post, we'll outline how you can use AppSignal to optimize your application's Prisma integration, mitigate inefficient database queries, spot anomalies, and improve your application's scalability.