Operations | Monitoring | ITSM | DevOps | Cloud

The latest News and Information on Monitoring for Websites, Applications, APIs, Infrastructure, and other technologies.

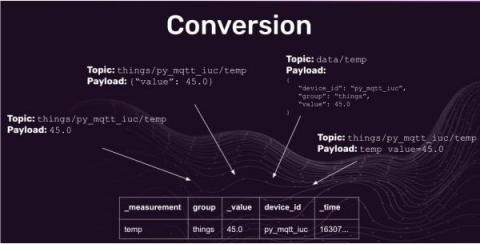
MQTT Topic and Payload Parsing with Telegraf

Buckle up, this one isn’t short…but I’m hoping it will be thoroughly informative! This post is about Telegraf as a consumer of MQTT messages in the context of writing them to InfluxDB. If you are interested in and unfamiliar with Telegraf, you can view docs here. Unsure if Telegraf aligns with your needs? I make a case for it in the Optimizing Writes section of this blog post. It may also help to have an understanding of Line Protocol, InfluxDB’s default accepted format.

Introducing the Sensu pipeline resource

Sensu’s observability pipeline includes resources for collecting, filtering, transforming, and processing observability data: checks, event filters, mutators, and handlers. These resources and Sensu’s observability pipeline concept are well seasoned and widely used at thousands of companies. However, configuration can be somewhat unintuitive, especially for new users.

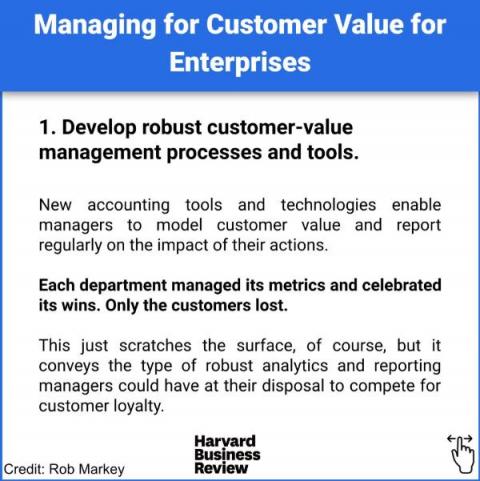
Managing for Customer Value for Enterprises

Earning customer loyalty is in the interest of both shareholders and management. Companies at the top of their industries in NPS or satisfaction rankings for 3+ years, grow revenues roughly 2.5x as fast as their industry peers and deliver 2-5x times the shareholder returns over the next 10 years. And here are 4 strategies that can help your company achieve consistent growth in customer value:.

5 Performance Measurement Metrics for Node.js Applications

Node.js applications are those that are created on the Node.js platform, which is an event-driven I/O server-side JavaScript environment based on Google Chrome's V8 engine. Since both the server-side and client-side are written in JavaScript, Node.js allows for easier and faster code implementation, as well as processing requests quickly and simultaneously. This is especially useful for developing real-time applications, such as chat and streaming.

Dashboard Fridays: Azure VM Health Dashboard

Adam is back for our final Dashboard Fridays video of 2021, and is joined by Azure expert and community hero Cameron Fuller of Catapult Systems! The Azure Management Services team at Catapult required a quick way to visualize the key health pieces for their customers, using a visually intuitive dashboard. In this bitesize video, Cameron will showcase this sample Azure VM Health dashboard focused on free disk space, heartbeat and CPU utilization. Tune in to learn how it was made, the challenges it solves, and how you can easily get your hands on it.

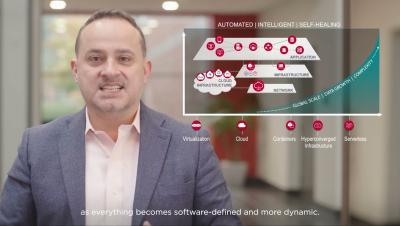
Broadcom Software Agile Operations Division Overview

General Manager Serge Lucio discusses Broadcom Software's Agile Operations Division, which offers business-critical software solutions that help the world’s leading companies transform their operating model to be more agile. Our ValueOps, DevOps, and AIOps solutions help these organizations drive innovation and achieve operational excellence to realize better business outcomes – and better experiences for their customers.

Monitoring remote user workstations with Prometheus, Ansible, and Grafana Cloud

Monitoring is usually associated with servers and applications, but the fintech automation platform Ocrolus recently needed to set up monitoring for a different purpose: to gain meaningful data and insights about nearly 1,000 remote user workstations.