Operations | Monitoring | ITSM | DevOps | Cloud

The latest News and Information on Monitoring for Websites, Applications, APIs, Infrastructure, and other technologies.

Icinga Notifications: Incidents, Escalations, and Event Rules

Following the Icinga Notifications beta announcement, we already had a more general post on how to get started and one going into the details of schedules. This week’s blog post is a follow up in this series and will describe incidents, escalations, and event rules in Icinga Notifications in more detail. In case you haven’t seen the first two referenced blog posts, you might want to have a look at them first, otherwise, you could miss out on the big picture.

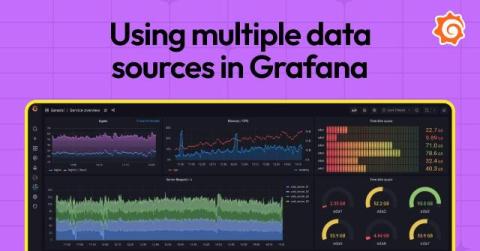
The Catchpoint Enterprise data source for Grafana: key features and how to get started

Earlier this year, we were thrilled to announce that Catchpoint is now available as an Enterprise data source for Grafana! With the public preview release of the Catchpoint Enterprise data source, you can seamlessly bring Catchpoint’s extensive Digital Experience Monitoring (DEM) and Internet Performance Monitoring (IPM) capabilities into your Grafana dashboards, enhancing your ability to visualize and analyze performance metrics in real-time.

Mastering Null Semantics: Translating SQL Expressions to OpenSearch DSL

Working at Coralogix, a leading full-stack observability platform, I recently faced an interesting challenge. The team I am part of is building the DataPrime query language and query engine, used to easily query logs and other observability data on the platform, usually in the form of Parquet files on AWS S3. Inside the engine, our DataPrime queries are transformed into query plans with SQL-like expressions, for example in filters.