Operations | Monitoring | ITSM | DevOps | Cloud

Latest Posts

Sponsored Post

Achieving a 12% performance lift migrating Raygun's API to .NET Core 3.1

Here at Raygun, improving performance is baked into our culture. We don't just think about our application performance, but more broadly, we look at our own infrastructure and ask if there's anything we can do to make it more performant for our business and for our customers. Two years ago, we switched our API from Node.js to .NET Core and achieved a 2000% increase in throughput. To continue that story, we recently upgraded .NET Core 2.1 to 3.1 and saw a 12% increase in performance. We enjoy presenting our performance findings, so in this post, we'd like to give some context into why we upgraded and the conditions that helped us achieve the 12% performance lift.

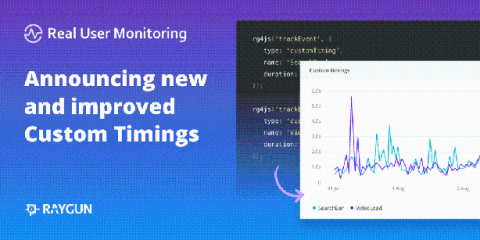
Track any web performance metric with improved custom timings for Real User Monitoring

Over the past few years, we’ve witnessed a couple of key trends in the performance monitoring space. Adoption of single-page applications (SPAs) has continued to grow and as such performance monitoring is evolving. SPAs don’t offer the same existing web metrics like load time or first paint from the browser performance API. As a result, developers require more flexibility to track the metrics that matter to their end-users and business.

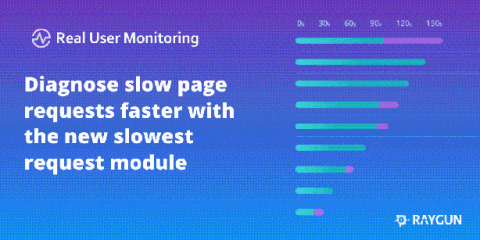
Diagnose slow page requests with the latest addition to RUM

Earlier in the year, we launched the request details page in Raygun Real User Monitoring. This update brought the instance-level insights into page performance to help you understand exactly what caused poor performance and how to improve it. To complement instance-level insights, this latest launch brings the Latest slowest requests module to Real User Monitoring. Now, when viewing performance data for a specific URI, you can easily jump into the instance-level diagnostics for a specific slow request.
Sponsored Post

Why high-performing teams consolidate monitoring tools with Raygun APM

Raygun helps thousands of software teams diagnose and resolve performance problems faster and more efficiently. We understand that in today's current climate, there is even more pressure on teams to ensure software quality across the whole stack, all while being cost-effective. It's no easy task! But we know that consolidating tools can help.

How to identify and resolve front-end performance bottlenecks

We all want lightning-fast websites and applications, but how do we prioritize our efforts in order to have the biggest impact on performance? We interviewed our own front-end team so we could share some best practices we use every day to improve and maintain the performance of Raygun.
Sponsored Post

The top web performance killers and how to prevent them

Loading speeds of websites will always be a tricky thing to manage. They depend on anything and everything between your user's choice of device and the server hardware your site runs on. There are many web performance killers that can be removed as you develop your web page. Removing as many of these barriers as possible is critical if you want your website to load smoothly and quickly for the majority of your users. Here are some suggestions for streamlining everything that is within your control to allow for the fastest possible load times for your users.

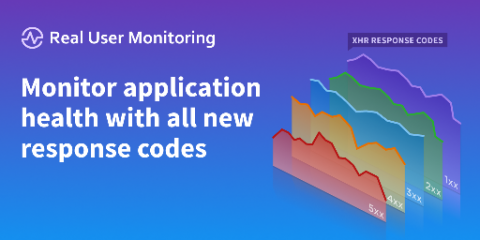
Monitor application health with the new response codes tab in RUM

In this release, we’re bringing an all-new section to Real User Monitoring to provide another way for you to monitor application health; the Response Codes tab. Real User Monitoring now tracks the response codes from XHR/AJAX calls made in your web application using the JavaScript provider. You can now: Stacked view of your application’s response codes This feature brings vital insight into the health of your applications so you can deliver the software experiences your customers deserve.

Ruby performance tips - how to optimize code from the ground up

Over the last few years, more developers have taken Ruby as their staple programming language. Who can blame them? It certainly has a lot of appealing features. For one, the syntax is easy to read and debug. A default MVC architecture within most Ruby frameworks is another alluring factor that may have had you using it as well.

Remote pair programming: Tips, tools, and how to measure

Remote pair programming is an Extreme Programming (XP) methodology which is a part of the Agile software development model. It takes the principle of pair programming to the remote workplace. Pair programming leads to higher quality code and fewer bugs by making continuous code reviews and synchronous collaboration possible. In traditional pair programming, two programmers sit side by side in front of the same computer.
Sponsored Post

Unlock next-level detail in Real User Monitoring with these latest improvements

In our latest release, we're rolling out a whole series of improvements to Raygun Real User Monitoring that gives you the instance-level data you need to understand exactly how your application is performing in every single user session. Armed with this level of diagnostic information, you and your team will know exactly where to spend time when improving the performance of a particular page.