Operations | Monitoring | ITSM | DevOps | Cloud

Latest Posts

What is NetFlow Analyzer?

In today’s interconnected world, network administrators face the daunting task of managing and securing complex networks. To effectively monitor network traffic and optimize performance, they require comprehensive insights into the data flows within their infrastructure. NetFlow Analyzer is an analytics tool that monitors network traffic flow. It leverages the ability of flow technologies to offer visibility in real time.

What is Palo Alto Panorama?

Palo Alto Panorama is a network management system (NMS) that provides excellent security updates and static rules in a constantly changing world. The modern world is implementing more technology into our daily lives, so we need more creative and innovative solutions to protect our data and information. Implementing Palo Alto Panorama will reduce administrator workload by building a dashboard where you can monitor all of your IT operations in one place, in real-time.

What is Citrix NetScaler, and how does it work?

Citrix NetScaler is a web application delivery controller (ADC) that can make applications run more efficiently. In some cases, they can run up to five times faster than without Citrix NetScaler. Also, it can reduce web application costs for the owner with server offloading, and it ensures that applications are readily available with its application load balancing features. Citrix more than 400,000 customers worldwide, with 99% of Fortune 100 companies and 98% of Fortune 500 companies.

Covering your bases: three ways to achieve network visibility

There’s an old adage that says happy employees equals happy customers. Reputable magazines like Forbes, Harvard Business Review, and Entrepreneur have dedicated significant brainpower to dissecting this concept, and customer success leaders acknowledge its truth. Just as in business, a little “self care” in IT will go a long way.

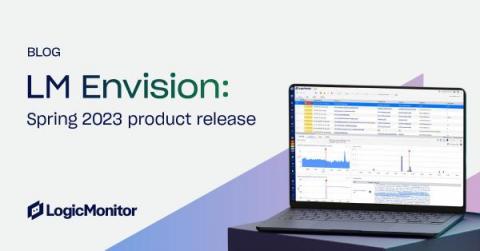
LM Envision: Spring 2023 product release lookback

Over the past few months, LogicMonitor released a number of enhancements to the LM Envision platform across all of our solutions. We’re excited to share some of these new capabilities with you. We’ll begin by looking at a few recent innovations within LM Envision, LogicMonitor’s unified monitoring platform.

Automating with LogicMonitor: Ansible, Terraform, Stackstorm

Automation has been a bit of a buzzword in the IT community in the last few years. Companies around the world are looking for ways to scale and automate routine tasks so they can focus on more strategic initiatives. But “automation” is a word that can cover a lot of workflows and can mean something different to every team. What do we mean when we talk about automation here at LogicMonitor?

Announcing LM Exporter

We recently introduced the LogicMonitor Exporter which is now a part of OpenTelelemetry Collector Contrib distro. This allows you to bring your collector for streaming telemetry data from your environment to LM Envision, LogicMonitor’s hybrid and multi-cloud monitoring platform. LogicMonitor associates the exported logs and traces from a single OpenTelemetry collector to simplify your application’s operations and troubleshoot issues.

Web checks in Kubernetes: a simple alternative to Prometheus Blackbox Exporter

The continued adoption of Kubernetes, a leading container orchestration platform, increases the demand to monitor these complex environments accurately and efficiently. Maintaining optimal performance and ensuring quick issue resolution are vital aspects of efficient Kubernetes management.