Operations | Monitoring | ITSM | DevOps | Cloud

Latest Posts

Why the visibility gap is holding your IT operations back

Depending on your business, MTTR stands for mean time to repair or mean time to recovery – but it can also mean resolution, resolve, or restore. No matter how you define it, the basic measurement is the same: it’s the time it takes from when something goes down to when it is back and fully functional. This includes everything from finding the problem to fixing it. For ITOps teams, keeping MTTR to an absolute minimum is crucial.

LogicMonitor Maintains Leader Rankings in G2 Spring 2023 Reports

G2’s Spring 2023 Reports were announced March 30, 2023, with LogicMonitor grabbing several number-one spots and Leader rankings. This recognition is based on the responses of real users featured in the G2 review form. “Rankings on G2 reports are based on data provided to us by real software buyers,” said Sara Rossio, Chief Product Officer at G2.

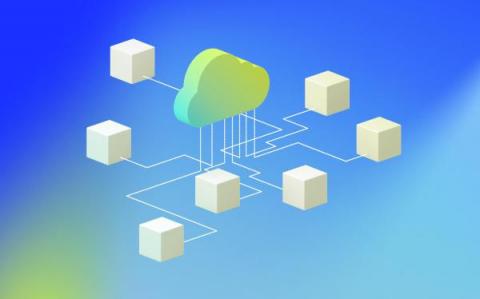
What do you see in the clouds?

Remember being a carefree kid? Laying down in a field on a warm spring day, gazing up at the sky, and imagining shapes in the clouds. Maybe you saw a lion or an elephant dancing across the sky. You felt grounded and safe, enjoying the breeze while listening to cheers from the football game in the distance. But could you see the rain forming on the horizon threatening to distort your animal shapes and send the football team running for cover?

Agent-based versus agentless data collection: what's the difference?

In the quest for a secure and reliable method to monitor their infrastructure, enterprises and service providers often find themselves exploring various agent-based and agentless solutions. Grasping the nuances between these two approaches is essential to select a monitoring service that aligns with your unique business requirements.

The Comprehensive Guide to SNMP

Simple Network Management Protocol (SNMP) provides a standard message format that devices being monitored and monitoring systems can all speak – even though they will be running different operating systems. SNMP is the most widely deployed management protocol; it is simple to understand (although not always to use), and enjoys ubiquitous support.

Comprehensive Kubernetes Observability with LogicMonitor's Kube-State-Metrics Integration

With the growing popularity of Kubernetes, the need for effective monitoring solutions has become crucial. LogicMonitor, a leading cloud-based monitoring and observability platform, has rolled out a new set of DataSources in its Kubernetes monitoring solution, LM Container, that uses data from the kube-state-metrics service to provide enhanced visibility into the state of Kubernetes objects.

The flexibility to meet you where you work: creating custom HTTP alert integrations with LogicMonitor

Not everyone on your team lives in LogicMonitor — some might never go into the platform! But that’s okay because LogicMonitor’s Alert Integrations are designed with extensibility in mind. LogicMonitor’s flexible approach to alerts ensures that you receive alerts in the place you work, alerts are routed to the right team member, and you are not overwhelmed by alert storms or alert fatigue.

How do IT issues affect workplace morale and productivity?

Employee morale can make the difference between a struggling company and one that’s thriving and growing. High levels of engagement and enthusiasm amongst the workforce happen at organizations run like a well-oiled machine. Each department works hand in hand with the other, with everyone working toward the same goal. Even though all parts of a company are responsible for a strong company spirit, IT issues have a powerful impact.

How Are SASE and SD-WAN Related?

SD-WAN and SASE both build on traditional network models, such as those used to connect a company’s offices. While the two models share some features and advantages, they have different structures and approaches. In the simplest terms, an SD-WAN inspects and routes data more efficiently, while a SASE combines networking and security functions into a single service. Here’s what you need to know.

Monitoring Kubernetes Object Configuration with LogicMonitor

Kubernetes has emerged as the de facto standard for container orchestration in modern software development, allowing organizations to manage and scale containerized applications easily. As a highly dynamic and distributed system, however, Kubernetes can be challenging to manage and maintain at scale. One of the most critical aspects of maintaining a stable and secure Kubernetes cluster is monitoring the object configurations and tracking the changes over a period of time.