Operations | Monitoring | ITSM | DevOps | Cloud

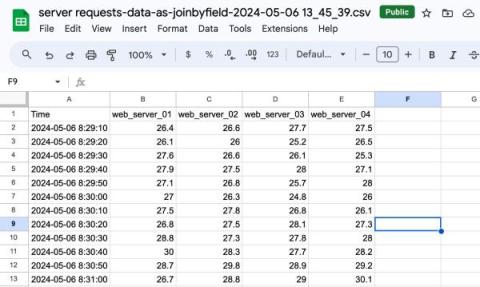
How to export any Grafana visualization to a CSV file, Microsoft Excel, or Google Sheets

Grafana dashboards are a great way to combine a lot of technical information into one convenient picture. From time to time, it’s also useful to export data from a particular Grafana visualization to another format, so you can further analyze it and share it with others. In this blog post, we’ll walk through how to export CSV data for any Grafana visualization you use. This makes it easy to get that data into popular spreadsheet applications, such as Microsoft Excel or Google Sheets. =
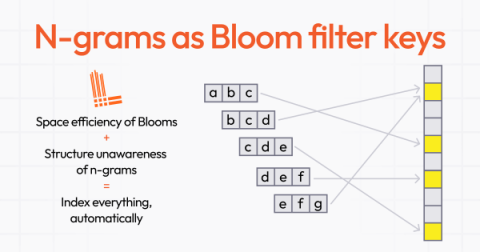
Grafana Loki query acceleration: How we sped up queries without adding resources

As we discussed when we rolled out the latest major release of Grafana Loki, we’ve grown the log aggregation system over the past five years by balancing feature development with supporting users at scale. A big part of the latter has been making queries much faster — and that was a major focus with Loki 3.0 too. We’ve seen peak query throughput grow from 10 GB/s in our Loki 1.0 days to greater than 1 TB/s even before 3.0.

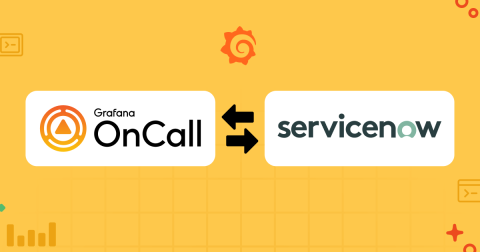
Grafana OnCall: Use the new bi-directional ServiceNow integration for seamless alert flows

Every moment counts when you’re managing incidents that can affect your services and customers. That’s why we’re excited to introduce a new bi-directional integration between Grafana OnCall and ServiceNow, a popular platform many large organizations rely on to help manage their incidents.

Serverless observability: How to monitor Google Cloud Run with OpenTelemetry and Grafana Cloud

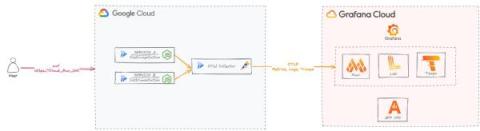
OpenTelemetry has emerged as the go-to open source solution for collecting telemetry data, including traces, metrics, and logs. What’s especially unique about the project is its focus on breaking free from the reliance on proprietary code to offer users greater control and flexibility. As a senior solutions engineer here at Grafana Labs, I’ve spent a lot of time exploring OpenTelemetry, including in my spare time.

How to visualize Amazon CloudWatch metrics in Grafana

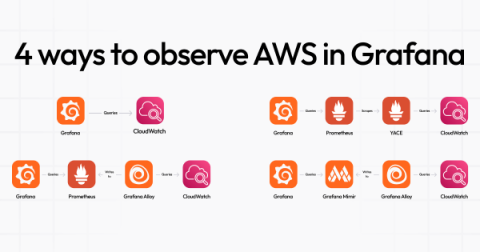
In the wide world of observability, you have many options for visualizing metrics collected by Amazon CloudWatch. And because of that, you’re often left making lots of decisions — about cost, configurations, flexibility, and more. At Grafana Labs, we stick to our “big tent” philosophy, which means we don’t force you into a decision or even tell you that you have to bring your CloudWatch metrics to Grafana Cloud.

How to use Grafana Beyla in Grafana Alloy for eBPF-based auto-instrumentation

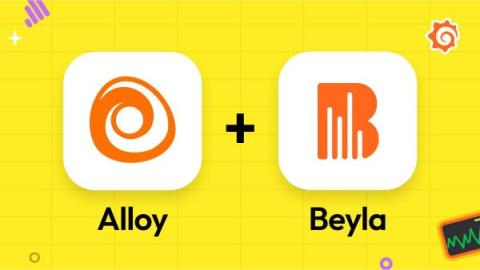
At GrafanaCON last month, we announced Grafana Alloy, our open source distribution of the OpenTelemetry Collector. Alloy is a telemetry collector that is 100% OTLP compatible and offers native pipelines for OpenTelemetry and Prometheus telemetry formats, supporting metrics, logs, traces, and profiles. Today, we are excited to share that Grafana Beyla is now available in Grafana Alloy as the default eBPF-based application auto-instrumentation solution.

Grafana OnCall: Connect to Discord, Mattermost, and more with webhooks

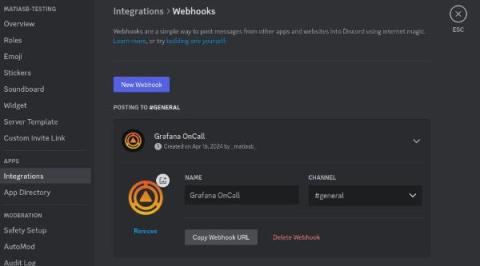
One important consideration when adopting a tool is whether it can integrate with your existing workflows and services. Each scenario can be highly specific, which is why it’s important to look for tools that have a public API or customizable webhooks. Last year, Grafana OnCall expanded its webhook support to allow for more complex setups, offering greater flexibility to interact with other services during alert group events.

Grafana Cloud updates: revamped Synthetic Monitoring, improvements to Kubernetes Monitoring, and more

We consistently release helpful updates and fun features in Grafana Cloud, our fully managed observability platform powered by the open source Grafana LGTM Stack (Loki for logs, Grafana for visualization, Tempo for traces, and Mimir for metrics). In case you missed it, here’s a roundup of the latest and greatest updates for Grafana Cloud this month. You can also read about all the features we add to Grafana Cloud in our What’s New in Grafana Cloud documentation.

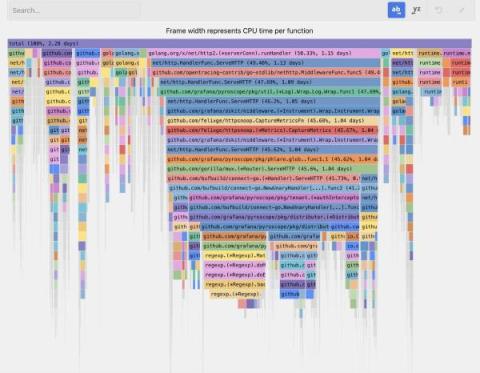
AI-powered insights for continuous profiling: introducing Flame graph AI in Grafana Cloud

Like many in the observability space, we see a lot of potential in harnessing AI to enhance the developer experience. As we continue to evolve and expand our observability platform, we strive to develop features that not only solve complex problems, but make it easier to access and derive value from tools like Grafana Pyroscope.

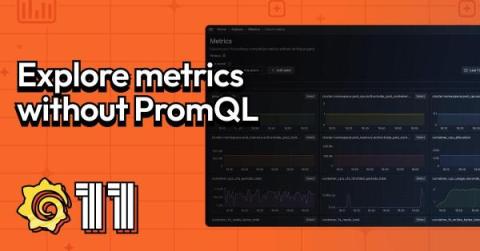
How to explore metrics without PromQL queries in Grafana

At GrafanaCON 2024, Grafana founder Torkel Ödegaard introduced Grafana 11, which has a feature set that aligns with the same goals we’ve had since the OSS project launched in 2013. “The core mission of Grafana that we’ve had from the start is to make observability easy and powerful through good UX design, a focus on ease of use, and user flexibility and freedom,” Torkel said.