Operations | Monitoring | ITSM | DevOps | Cloud

Latest Posts

A Closer Look at Lazy Loading Grafana Dashboards

Lazy loading of dashboard panels has been a popular feature request from the Grafana community for many years, and it was finally added in v6.2. In previous versions, the moment you opened a dashboard Grafana will issue queries for every panel, even those you have to scroll to see. This can create high peaks in load to your data source backends. Meanwhile, you may never actually scroll down to look at all of those panels, so executing queries for those panels would have been pointless.

Inside Grafana Labs: Our Workspaces Revealed

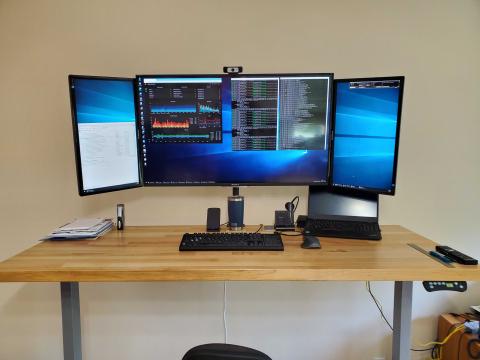
A post-geographical culture means more than putting a face to the name. Here, the Grafana Labs team is also putting a photo to the workspace. Check out the setups that have been where some of the latest Grafana releases and products have been developed. What you’ll learn is that not only is the Grafana Labs team adept at creating dashboards, supporting hosted services, and hosting conferences.

Pro Tips: How to Decrease MTTR and Increase Uptime with Grafana and VictorOps

We can sift through oceans of data. Alert on predetermined parameters. Deliver multiple commits a day. But as organizations leverage these layered, complex monitoring systems, “we also have to start practicing observability to enrich the actions that we take to solve problems as they occur and drive continual improvement,” said VictorOps Product Marketing Manager Melanie Postma. VictorOps is one tool that can help accomplish that.

Pro Tips: How Amgen Manages On Calls (and Burnout) with Grafana

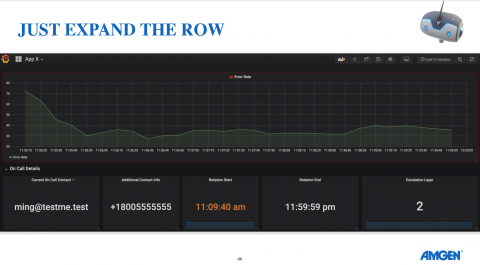
There is a lot of talk about graphing all the things, but have you ever considered graphing all the people – in particular their on calls – as well? “Not letting people burnout on call is something that is being talked about in the industry,” said Jordan J. Hamel, Design Engineer at the biotech company Amgen.

How to Mix Metrics and Logs with Grafana and Influx

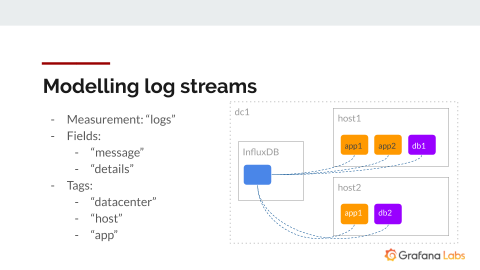
It’s time to stop thinking of Grafana as a general dashboarding tool. “Grafana Labs is on a journey to becoming a developer’s observability platform to support your classic DevOps use cases,” said Grafana Labs’ Director of UX, David Kaltschmidt, at a recent talk given at the 2019 InfluxDays Conference in London.

Community Spotlight: BigQuery Plugin

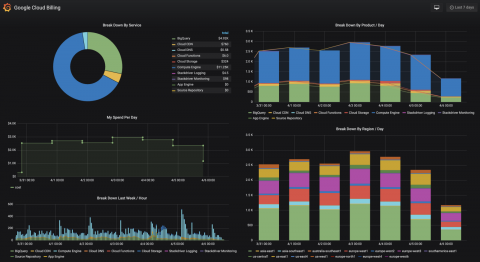
The Grafana community comes up with some pretty cool stuff, and we’re hoping to spotlight some of it from time to time. Today, we’re starting with the BigQuery datasource plugin developed by the team at DoiT International. DoiT is a reseller of Google Cloud and AWS that helps companies either move from on premise to cloud or move from one cloud provider to another.

A Look Inside GitLab's Public Dashboards

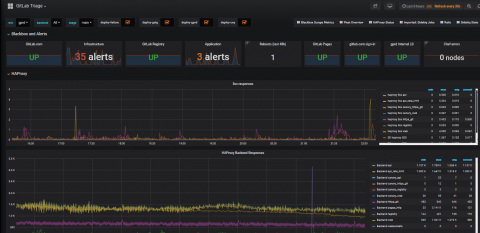
There are transparent companies – and then there’s GitLab. “GitLab is a ridiculously transparent company,” said Ben Kochie, a Staff Backend Engineer for Monitoring at GitLab. “When GitLab has a database outage, we live stream the recovery on YouTube.” GitLab has the same bare all approach to its metrics. “All of our Prometheus metrics are available on a public Grafana dashboard,” Kochie told the crowd gathered at GrafanaCon.

Grafana Tutorial: Simple Synthetic Monitoring for Applications

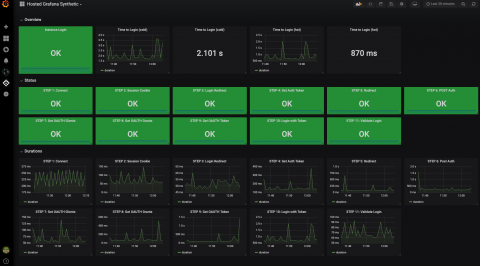
Often there’s a focus on how a service is running from the perspective of the organization. But what does service health monitoring look like from the perspective of a user? There are many metrics that indicate the overall health of a container, vm, or application, but independently they do not indicate if the system is functioning correctly. Often these metrics (CPU, disk, memory) are too narrow, and they can be poor indicators. High CPU may be desirable or bursts of memory usage may be normal.

How Grafana Labs is Democratizing Metrics Now

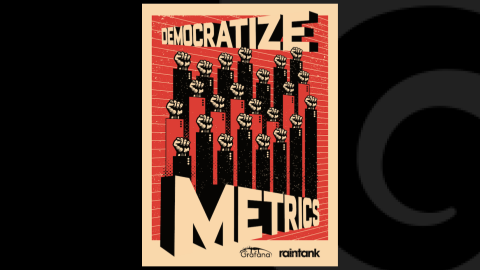
Metrics for all – and all for metrics. At Grafana, we not only strive to give people a “single pane of glass” to unify observability metrics. From the very start, our mission has been to advocate for the democratization of metrics, which is the idea that the paradigm needs to shift between who can store data, why they need to store it, and, ultimately, what they’re able to with it. And Grafana users are a great example of how vast and varied the needs are for data access.

An Open Technology Stack for Industrial IoT

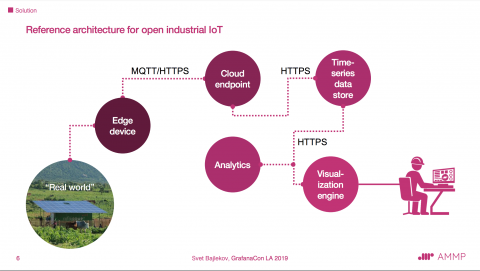
AMMP Technologies runs monitoring for energy systems, usually off mini-grids in Africa. The company uses Grafana to monitor interface with physical objects that are not servers or containers. “It’s interesting how a toolkit for visualizing essentially internet/computer/server metrics is so well-suited to working with real-life streaming data,” AMMP Cofounder Svet Bajlekov said during his talk at GrafanaCon L.A.