Operations | Monitoring | ITSM | DevOps | Cloud

Latest Posts

Time Series Differencing: A Complete Guide

Time difference analysis is a method of analyzing data points at regular time intervals over a set period. However, in time series analysis, we derive crucial information such as the variance of the variables among data points over a period of time. This gives additional information on how the data adapts over time. This can be used to analyze data during different trends at different time intervals.

Webinar Recap: Saving the Holidays with Quix and InfluxDB: The Open Telemetry Anomaly Detection Story

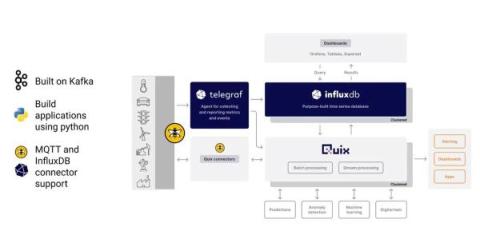
Just in time for your holiday viewing! Learn how to solve real-time time series processing challenges with Quix—the stream processing framework using Kafka and Python—and purpose-built time series database InfluxDB.

5 Best SIEM Tools and How to Choose

Cybersecurity has become something of great concern to the IT world over the last few years. The increase in remote working and the move to cloud-based and e-commerce solutions have opened up many new opportunities for cyber exploits and malware attacks. According to the FBI, the incidence of malware and network attacks, particularly ransomware, on both commercial and home systems has shown a major increase. At a corporate and personal level, ID theft has also increased greatly.

Time Series Data and Real World AI: A Fireside Chat

Recently, InfluxData CEO Evan Kaplan sat down with Developer Advocate Jay Clifford to discuss the role of time series data and AI in industry, how it’s evolving, and specifically, the role of time series data in AI. They also discussed the future of InfluxDB in terms of real-time analytics and its role in the AI landscape.

Webinar Recap: Building an AI Anomaly Detection Pipeline with InfluxDB

In this webinar hosted by InfluxDB and HiveMQ, we focus on how you can create value for your business using new tools in the AI and database ecosystem to quickly deploy AI models to perform tasks like anomaly detection. The webinar starts with a high-level overview of how MQTT and time series data can be valuable in an industrial IoT environment.

Data Lakehouses Explained

The big data landscape is always changing to solve existing problems and continues to push the boundaries of performance and scale. Data lakehouses are a new architectural pattern that is rapidly gaining popularity by solving a variety of problems seen with previous solutions like data warehouses and data lakes. In this article, you will learn the following.

A Guide to Predictive Maintenance & Machine Learning

Various economic pressures on businesses have created a focus on new and innovative ways to manage operational costs. At the same time, businesses are looking at using IT to help manage overall business costs and increase income—for example, by supporting remote working, and in many cases, enabling e-commerce to replace closed retail outlets.

Grafana Dashboard Tutorial: How to Get Started

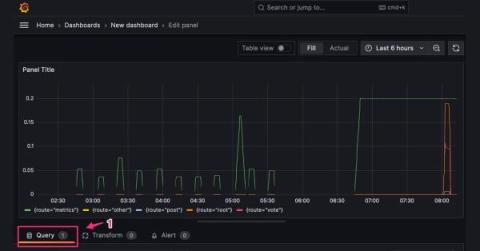
Grafana is an open-source web application for visualizing data. You can query your data, create visuals, and receive alerts to better understand what you have. Some people think of Grafana as a Kubernetes-only tool, but in reality, it’s simply a data visualization tool that became popular within the Kubernetes ecosystem, especially when combined with Prometheus. In this post, I’ll focus on a very specific part of Grafana: the dashboards.

Data lakes vs data warehouses explained

In the era of big data, choosing the right data storage solution is crucial for organizations to harness the power of their data. Understanding the differences and benefits of data lakes and data warehouses can help businesses make informed decisions on which option best suits their needs. In this blog post, we will explore data lakes and data warehouses, their architecture, and their key features, enabling you to make the right choice for your organization.