Operations | Monitoring | ITSM | DevOps | Cloud

Latest News

Observing Core Web Vitals with OpenTelemetry: Part Two

Core Web Vitals (CWV) are Google's preferred metrics for measuring the quality of the user experience for browser web apps. Currently, Core Web Vitals measure loading performance, interactivity, and visual stability. These are the main indicators of what a user’s experience will be while using a web page: Note: As of March 12th, INP has become a stable Core Web Vital, replacing First Input Delay (FID).

How an APM Alternative Helps You Do Observability Right

Every software-driven business strives for optimum performance and user experience. Observability—which allows engineering and IT Ops teams to understand the internal state of their cloud applications and infrastructure based on available telemetry data —has emerged as a crucial practice to help engage this process. For years, application performance monitoring (APM) was the de facto practice and tooling that organizations have used to keep tabs on their critical systems.

Optimizing Operations: A Look At Observability For Manufacturers

As the automation of processes and deployment becomes more prevalent in the manufacturing industry, the need for IT services grows further. The use of complex systems and technologies, such as AI and robotics has become the new normal for manufacturing organizations.

Beyond the trace: Pinpointing performance culprits with continuous profiling and distributed tracing correlation

Observability goes beyond monitoring; it's about truly understanding your system. To achieve this comprehensive view, practitioners need a unified observability solution that natively combines insights from metrics, logs, traces, and crucially, continuous profiling. While metrics, logs, and traces offer valuable insights, they can't answer the all-important "why." Continuous profiling signals act as a magnifying glass, providing granular code visibility into the system's hidden complexities.

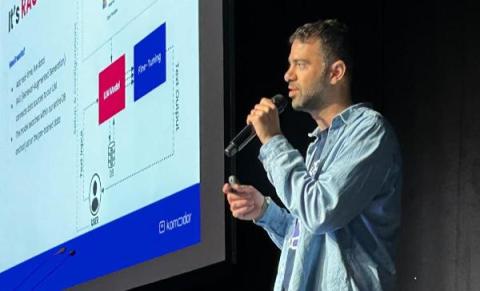
Do We Still Need to "Observe"? The Future of AI & O11y

AI has had a massive impact on every part of our lives, but mainly on how we consume large data sets easily. The observability world is based on collecting enormous amounts of data and consuming it by observing dashboards built on monitoring tools. Most of the o11y tasks like writing complex queries, creating dashboards & defining alerts, have been done much in the same way for the last decade & AI models are well-positioned to disrupt this modus operandi.

Open source log management tools in 2024

Log management tools provide visibility into the performance and behavior of systems, applications, networks, and infrastructure components. By collecting and analyzing logs, you can monitor for anomalies, track trends, and identify potential issues before they escalate. Choosing the right log management solution requires careful consideration of several factors to ensure that it meets your specific needs and goals. Here are the most popular open source log management tools to help you choose.

Frontend Debugging Is Bad and it Should Feel Bad

There’s a sentence that strikes fear into the heart of every frontend developer I've ever met: Users are reporting issues, and we don't know how to replicate them. What do you do when that happens? Do you cry? Do you mark the issue as wontfix and move on? Personally, I took the road less traveled: gave up frontend engineering and moved into product management (this is not actually accurate but it's a good joke and it feels truthy).

What Dynatrace doesn't want you to know about Cisco Full-stack Observability and AppDynamics

Cisco Full-Stack Observability is a strategic investment that outshines Dynatrace by incorporating AI-driven insights, full-stack visibility, and a future-proof design that adapts to your evolving business needs. Application experience is the heart of your digital business, so choosing the right observability platform is not just a technical decision — it’s strategic.

Observability Unpacked: 5 Takeaways From KubeCon + CloudNativeCon 2024

StackState had a blast at this year's KubeCon + CloudNativeCon gathering in Paris! The discussions were in-depth, covering a wide array of topics and lasting much longer than in the past. This year, attendees seemed to have a considerably deeper understanding of the cloud-native ecosystem, probably attributed to its rapid growth. We also noticed a pretty dramatic evolutionary shift in the vendors at the expo hall, who were showcasing some truly progressive specialized solutions.

How to Keep Observability Alive in Microservice Landscapes through OpenTelemetry

The concept of observability has become a cornerstone for ensuring system reliability and efficiency in modern software engineering and operations. Observability, beyond its traditional scope of logging, monitoring, and tracing, can be intricately defined through the lens of incident response efficiency—specifically by examining the time it takes for teams to grasp the full context and background of a technical incident.