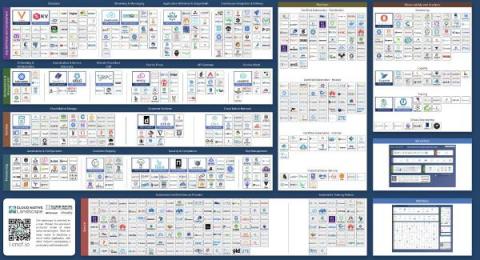
Today, we’re starting Relay by Puppet, a new initiative to build the future of cloud-based DevOps automation. This post captures our musings about the evolving world of cloud-native infrastructure and how Relay addresses this evolution.
On one of the EUC slack forums, a question was recently posted asking what are the key lessons learned in the last year and what changes organizations should investigate in the next year. The answers were revealing. Several folks pointed out that prior to the pandemic, we were operating within the comfort zone of carefully planned deployments with managed devices and managed networks.
What fun is network observability if you can’t share what you see? That’s why we’ve added public link sharing to the Kentik platform. One of the greater missions of network observability is to break the boundaries of conventional monitoring. At Kentik, we focused our initial efforts on making complex infrastructure problems easy to visualize, understand and resolve. Now we’re tackling a follow-up mandate: to democratize network observability.
This is the first part of a multi-part post focusing (mostly) on front end search and Command Palettes. If you are not familiar with Command Palettes, they are a power-user's dream: a universal overlay on your webpage that's triggered with a key shortcut (usually Command + K) and allows your users not only to search the content but also perform actions on your website. The goal here is to "keep the user's hands on the keyboard" (and away from the mouse), when using your application.
HAProxy is one of the most popular software around when it comes to load balancers and reverse proxies. When you’re using it for these purposes, it’s especially important to monitor for both availability and performance, which will impact your SLI and SLOs. In this post, we’ll talk about the main HAProxy metrics you should monitor and the best monitoring tools you can use to measure them.