Operations | Monitoring | ITSM | DevOps | Cloud

How to visualize time series from SQL databases with Grafana

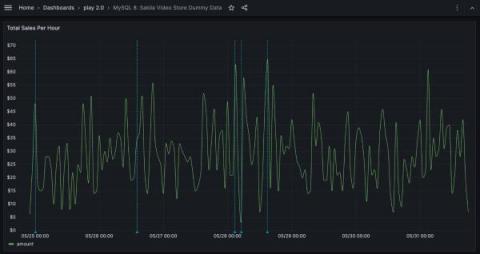
Relational databases like MySQL, PostgreSQL, Oracle, and others have a wealth of time series data locked inside of them. Often this data can be used to enhance observability dashboards, or keep track of important application factors, like how many users have signed up for a service. In this article, we’re going to show you how to visualize any time series from any SQL database in Grafana using the time series visualization.
Graphite Graphing and Monitoring tool

The Graphite graphing and monitoring tool is open-source software for monitoring time-series data, and it can be installed on any system, from cheap hardware to the cloud. Graphite collects time series data from infrastructure, servers, networks, and applications, and then provides the Graphite graphing UI for analyzing the data. Graphite has been around since 2008, and it has been continuously developing over the past 12 years.

Detecting Main Thread Issues in Mobile Applications

Mobile device users care about three things when it comes to good app performance: We’re going to look at how modern concurrency APIs can help with some of these. We recently shipped a new profiling feature to help you find the sources of main thread contention; specifically detecting issues with image and JSON decoding or regex matching. These point you to spots where you can immediately make improvements to your app’s UI performance.

Accelerating R&D in pharma with Elasticsearch, ESRE, LLMs, and LangChain - Part 1

A comprehensive guide to support faster drug innovation and discovery in the pharmaceutical industry with generative AI/LLMs, custom models, and the Elasticsearch Relevance Engine (ESRE) Faster drug discovery leading to promising drug candidates is the main objective of the pharmaceutical industry. To support that goal, the industry has to find better ways to utilize both public and proprietary data — at speed and in a safe way.

How Metrics Behave in Honeycomb

Honeycomb has the ability to receive events from applications. These events can take the shape of Honeycomb wide events, OpenTelemetry trace spans, and OpenTelemetry metrics. Because Honeycomb’s backend is very flexible, these OpenTelemetry signals fit in just fine—but sometimes, they have a few quirks. Let’s dive into using metrics the Honeycomb way and cover a few optimizations.

CNAPP: A Comprehensive Solution for Cloud-Native Application Security

A unique approach to security is needed when developing cloud-native apps that use microservices, containers, and serverless computing. The specific security issues that these cloud-native architectures provide are the focus of CNAPPs. Traditional security solutions are frequently created to protect on-premises infrastructure and applications. However, new security strategies are required due to the adoption of cloud-native architectures and the migration to cloud computing.

What is Event-Driven Automation? Event-Driven Automation Programming Examples

Event-driven automation can turn repetitive, manual, daily tasks into something that you set and forget. It’s a great way to trigger automatic events and prevent human error. In this blog, we'll explore a few event-driven automation programming examples, from sending an email to a certain group of users when a file has been uploaded to a server to generating reports.

Improving discoverability of the git blame functionality on Bitbucket Cloud UI

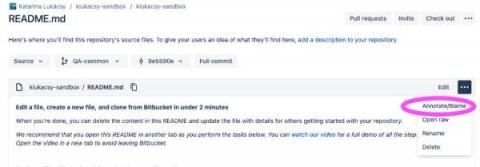
We are making git blame feature more discoverable on the Bitbucket Cloud UI. A very useful feature of git, git blame has been available on the Bitbucket Cloud UI for years. Similar to how git blame works with git, on Bitbucket Cloud it annotates each line in the given file with information from the commit which introduced the line.

Replay Data From Object Storage for Long-term Incident Investigations

Psst, hey pal, would you like to buy a time machine? I am not talking about some H.G. Wells monstrosity where you somehow end up being chased by dinosaurs or become your own grandparent. But a time machine for your observability data. License costs and tool performance often keep organizations from ingesting all their data or require them to limit data retention time. Security incidents are often discovered long after these retention times are exhausted or require data that was never ingested.

The Ins and Outs of SaaS Network Monitoring: A Comprehensive Guide for Optimal Performance

Businesses rely heavily on their networks to maintain smooth operations, enable seamless communication, and facilitate efficient data transfers. However, network instability can throw a wrench into even the most well-oiled business machinery, resulting in frustrating delays, dropped connections, and reduced productivity. This is where network jitter monitoring comes to the rescue.