Operations | Monitoring | ITSM | DevOps | Cloud

The Ins-and-Outs of Hardware Monitoring

Avid PC gamers know that if you want optimal performance, you have to push your computer to its limits. And if your gaming “rig” is not properly equipped with a large interior fan, your PC can overheat, resulting in more than a few performance issues. It is the same for enterprise-level devices or pieces of hardware: overheating creates problems. One such enterprise-level piece of hardware (and arguably the most crucial piece of equipment) is a server.

eG Enterprise adds Advanced Performance Monitoring of Snowflake

I’m delighted to share that version 7.2 of eG Enterprise has introduced support for performance monitoring of Snowflake databases. eG Enterprise’s integration with Snowflake enables complete visibility into the Snowflake architecture and operations, alongside the performance and costs of any dependent cloud hosted infrastructures such as AWS or Azure.

Reducing the cost of cloud: Tips for reducing your spend at any cloud provider

Spiraling costs are causing organizations to look for ways to reduce their monthly spend – hidden charges and unexpected bills are surprises that CFOs can no longer afford. With current costs from hyperscaler cloud providers skyrocketing, many are now asking whether going cloud-native is the right move for them. There are, however, a number of tips and tricks that you can action today that will help you reduce your cloud bill at any provider.

Modernizing Network Data Analytics With a Unified Data Repository

Analyzing multiple databases using multiple tools on multiple screens is error-prone, slow, and tedious at best. Yet, that’s exactly how many network operators perform analytics on the telemetry they collect from switches, routers, firewalls, and so on. A unified data repository unifies all of that data in a single database that can be organized, secured, queried, and analyzed better than when working with disparate tools.

Three Ways to Make the Most out of Honeycomb Metrics

A while ago, we added Metrics to our observability platform so teams could easily see system information right next to their application observability data—no tool or team switching required. So how can teams get the most out of metrics in an observability platform? We’re glad you asked! We had this conversation with experts at Heroku. They’ve successfully blended metrics and observability and understand what is most helpful to know.

Matter on Ubuntu: getting started with the standard for smart home devices

Canonical joined the Connectivity Standards Alliance last year to lead the charge for Linux in the smart home. The Matter standard is a particular focus for us. Its secure design and open ecosystem align well with Ubuntu’s own values of security and openness. Ubuntu Core and Matter make for a powerful pair. Ubuntu Core’s containerisation makes it a highly secure OS that pairs well with the highly secure protocol.

Overcoming Kubernetes Monitoring Challenges with Observability

At Logz.io, we’re seeing a very fast pace of adoption for Kubernetes–at this point, it’s even outpacing cloud adoption, with companies running on-prem fully adopting Kubernetes in production. Why are companies going in this direction? Kubernetes provides additional layers of abstraction, which helps create business agility and flexibility for deploying critical applications. At the same time, those abstraction layers create additional complexity for observability.

How Monitoring as Code Reduces the Time to Detect and Resolve Issues

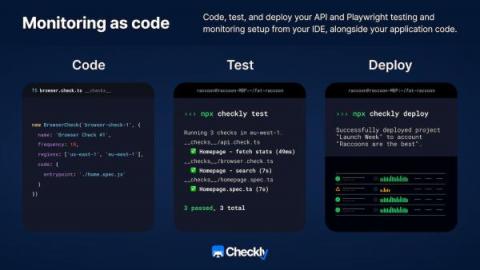
A web application or an API breaking is a matter of when, not if. Whether the cause is buggy code making it to production or infrastructure failing to support the software built upon it, incidents of varying severity are the norm rather than the exception, appearing frequently enough that the industry has coined the terms Mean Time To Detect (MTTD) and Mean Time To Recovery (MTTR).

Datadog's shocking bill of $65 million, pricing comparison of SigNoz with other tools - SigNal 24

Welcome to our monthly product newsletter - SigNal 24! Last month, our team worked on the upcoming trace and logs explorer page. With the new update, our users will be able to drive deeper insights into their application performance quickly. We also attended open source focused meetups and published a cost comparison blog comparing SigNoz with other popular observability tools. Let’s dive in to see what humans at SigNoz were up to in the month of April 2023.

DEX's Role in Bringing Generations Together

For the first time in history, there are four generations in the workforce. This puts organizations in a unique situation – how do you make the correct adjustments for such a wide-ranging workforce? We are interacting with tech in nearly every aspect of our lives. And each generation has their own preferences, expectations and drivers for using tech.