Operations | Monitoring | ITSM | DevOps | Cloud

Is Managed Prometheus Right For You?

Prometheus is the de facto open-source solution for collecting and monitoring metrics data. Its straightforward architecture, operational reliability, minimal upfront cost, and versatility in integrating with cloud-native systems make it the preferred choice for many. Getting started is as simple as configuring the Prometheus server and setting simple parameters such as the scrape intervals and targets, cadence, and setting the job name based on the function of the server.
Predictive Maintenance for Industrial IoT Devices at the Edge

In industrial operations, time is money. The more efficient processes and machinery are, the better it is for business. Providing proactive monitoring and maintenance of industrial machines, however, is not an easy task. This is especially true as these machines become increasingly complex and distributed. It’s not possible to have maintenance crews on site for every asset in a distributed system. The edge is where the physical world meets the digital world.

Monitoring Kubernetes Object Configuration with LogicMonitor

Kubernetes has emerged as the de facto standard for container orchestration in modern software development, allowing organizations to manage and scale containerized applications easily. As a highly dynamic and distributed system, however, Kubernetes can be challenging to manage and maintain at scale. One of the most critical aspects of maintaining a stable and secure Kubernetes cluster is monitoring the object configurations and tracking the changes over a period of time.

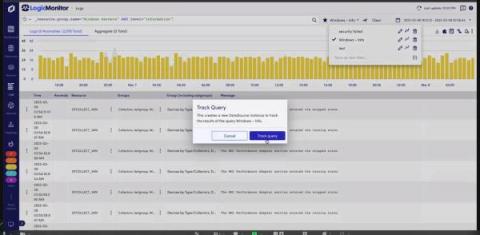
LM Logs query tracking: find what's relevant now to prepare for tomorrow

LM Logs offer intelligent log analysis with querying capabilities for all experience levels to analyze log data. But it’s most effective to know when to investigate deeper and conduct further analysis instead of trying to identify hidden trends in log data manually. The best way to determine what’s relevant now is to see if the amount of log data and message types produced in a device or service have drastically changed.

What is Azure Stack HCI?

Azure Stack HCI is a virtualized workload solution from Microsoft that allows businesses to run Windows and Linux apps and services in a hybrid on-premise/cloud environment. Built on top of Windows Server, Azure Stack HCI is an example of hyper-converged infrastructure (HCI). This technology virtualizes conventionally hardware-defined systems like storage and networking to create flexible, efficient infrastructure solutions.

Transforming Your Data With Telemetry Pipelines

Telemetry pipelines are a modern approach to monitoring and analyzing systems that collect, process, and analyze data from different sources (like metrics, traces, and logs). They are designed to provide a comprehensive view of the system’s behavior and identify issues quickly. Data transformation is a key aspect of telemetry pipelines, as it allows for the modification and shaping of data in order to make it more useful for monitoring and analysis.

Open sourcing the CircleCI Language Server

The official CircleCI extension for Visual Studio Code is now available for anyone to download on the VS Code Marketplace. This extension was developed by the Developer Experience team of CircleCI and it includes two sets of features: the pipeline manager and the config helper. The config helper provides language support for CircleCI YAML files.

A Kubernetes Observability Tool to Support SRE Best Practices

Kubernetes can be tough to troubleshoot and remediate fast, especially when you have many interdependent services. This blog, part 3 of 3 in the “8 SRE Best Practices to Help Developers Troubleshoot Kubernetes” series, describes the Kubernetes observability foundation StackState has built to support SRE best practices and enable rapid remediation of issues.

Why You Should Utilize the SNMP Monitoring Tools in N-central

Network device monitoring is a crucial aspect of IT management and it helps organizations to ensure that their network infrastructure is running smoothly. Many people that use RMM solutions will often use an additional application to monitor their network devices. However, one of the huge benefits of using N-able N-central as your RMM solution is the way it allows you to monitor network devices through Simple Network Management Protocol (SNMP).

Identify the root causes of issues and bottlenecks in your build pipelines with TeamCity and Datadog

TeamCity is a CI/CD server that provides out-of-the-box support for unit testing, code quality tracking, and build automation. Additionally, TeamCity integrates with your other tools—such as version control, issue tracking, package repositories, and more—to simplify and expedite your CI/CD workflows.