Operations | Monitoring | ITSM | DevOps | Cloud

2019 Hurricane Season: Solidify a Business Continuity Plan With a Mass Notification Solution

Summer is typically synonymous with beach days, outdoor barbecues and fulfilling weekend getaways. Unfortunately, the summer months aren’t only about enjoyable moments and exciting vacations. It’s also tropical storm season, with higher risks of destruction, community displacement and business operation disruption. With this potential for human and business peril, it’s important for organizations to implement a business continuity plan, equipped with a robust communication strategy.
3X Growth is Quite a Milestone, And It's Only the Beginning

When you start a company – or a third company as is the case for Lee and me – you start with a problem statement, a product you believe in, and a lot of hope. This means when growth goes as planned or exceeds expectations, you shouldn’t be surprised. This is what is supposed to happen. Great Product + Market Opportunity + Great Team = Successful Business. Intellectually, I know all this, but it is still exciting to see it come to fruition.

Three Cybersecurity Trends for 2019

From online banking, insuring cars, and shopping, we are almost totally reliant upon the internet to complete daily tasks and make our lives easier. However, as technological advancements give us greater convenience, increase productivity, and provide greater access to whole new swathes of entertainment, consumers and businesses alike leave themselves at risk of cyberattacks against which robust defenses must be in place.

Logs to Monitor for Security Analytics

DevOps, security, and SOC teams find themselves constantly facing new cyber threats, ever-evolving attackers, and innovative attack vectors. Their challenges range from protecting employees’ mobile devices to preventing malicious parties from accessing an organization’s financial data or customers’ personal information.

Loki's Path to GA: Docker Logging Driver Plugin & Support for Systemd

Launched at KubeCon North America last December, Loki is a Prometheus-inspired service that optimizes storage, search, and aggregation while making logs easy to explore natively in Grafana. Loki is designed to work easily both as microservices and as monoliths, and correlates logs and metrics to save users money. Less than a year later, Loki has almost 6,500 stars on GitHub and is now quickly approaching GA.

How to Monitor Website Changes

Before, to know detect a website changed its content or not, you had to manually visit the website and check by yourself. This is a thing from the past! Tools such as Hyperping can send instant alerts in case of changes. One way is making sure your API or marketing site returns the expected content. Some servers return an expected status code (200, OK) but can often return the wrong content in the response body, whether it is HTML content or JSON.

Build better workflows: Announcing the Mattermost DevOps integration set

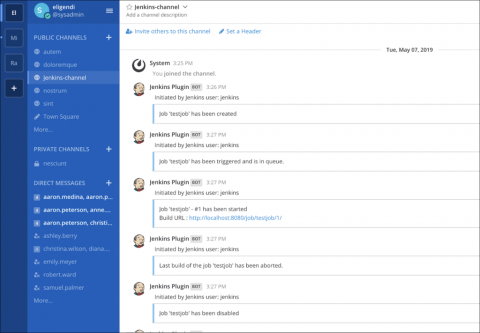
No matter what tools your team uses, more effective collaboration results from sharing information and context, being able to react quickly, and automating repetitive processes. Development teams move faster when they can consolidate information in one central hub and can reduce context switching by switching less between different tools.

How to monitor the proper functioning of a website

In times where it is possible to instantly access information, the website is the main point of communication with the market for every company. The website is often the place where the crucial first impression is built. It generates leads, sells, provides customer service, gets in touch with the media, recruits etc. It is the company’s website that the traffic from advertising campaigns gets directed to—and not only from the online ones.

What To Do When You Have 1000+ Fields?

So you have been adding more and more logs to your Graylog instance, gathering up your server, network, application logs and throwing in anything else you can think of. This is exactly what Graylog is designed for, to collect all the logs and have them ready for you to search through in one place. Unfortunately, during your administration of Graylog you go the System -> Overview screen and see the big bad red box, saying you are having indexing failures.

Maximize Observability of your CI/CD Pipeline with LogDNA

Continuous integration and continuous deployment (CI/CD) has enabled teams to build and deploy software at a much faster pace. DevOps teams can build, test, and deploy changes to production in a matter of minutes, allowing for extremely rapid release cycles. However, a CI/CD pipeline has a lot of moving parts and steps where problems to occur. In order to ensure a successful deployment, it’s important to monitor each step in this process.