The expert in health nutrition for cats and dogs reduces security risks in its shipping area and streamlines operations thanks to an automation solution.
You have a timeout in your application logs and a question in your AI assistant: what happened to this request? Hosted OpenSearch MCP works with any MCP-compatible AI client or model. Claude Desktop and Cursor are examples. This guide covers the Basic-auth prerequisite, client configuration and a first log search you can verify against records you already recognise. Contents.
When a parser breaks at 10:06, the first question is who changed what at 10:05. Every Logit.io Logs stack keeps an audit log that answers it, with the user, the IP address and the action. This guide shows how to read and export it, how to pull it from the Dashboard API, and how to ship it with Filebeat into logstash-* so it sits on the same OpenSearch Dashboards timeline as your application logs. Contents.
Calico, Cilium, Retina, and Netobserv: Which Observability Tool is Right for Your Kubernetes Cluster? Network observability is a tale as old as the OSI model itself and anyone who has managed a network or even a Kubernetes cluster knows the feeling: a service suddenly can’t reach its dependency, a pod is mysteriously offline, and the Slack alerts start rolling in. Investigating network connectivity issues in these complex, distributed environments can be incredibly time consuming.
Over the past years, StatusPal has been the product teams rely on to communicate clearly during incidents and maintenance. It’s the product our customers use today, and it remains central to how we support critical communication. We want to share how we’re thinking about the future of StatusPal, what this means for the product you’re using today, and how a newer version we’re building fits into the picture.
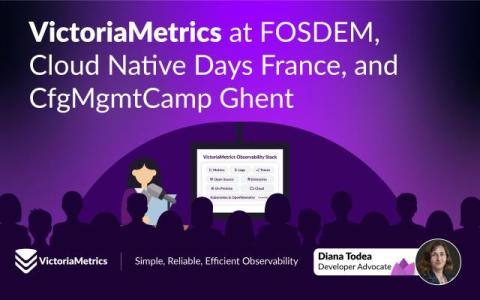
Last week, members of the VictoriaMetrics team, including myself, spoke at three very different but equally important community events: FOSDEM in Brussels, Cloud Native Days France in Paris, and CfgMgmtCamp in Ghent. Each event drew a different crowd with its own expectations, making them a good way to see where open source observability stands today and how VictoriaMetrics is adapting to real-world needs. The talks we gave were snapshots of the problems we are actively working on.
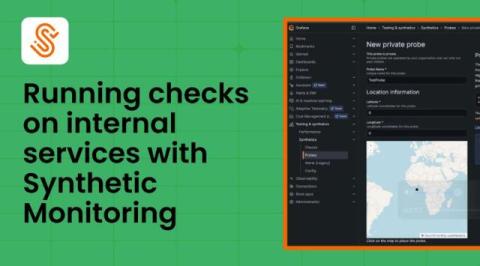
Many critical services run inside private networks, where traditional monitoring tools and practices can’t offer full visibility. This makes it difficult to validate service availability and performance before problems impact your users. Synthetic Monitoring — a Grafana Cloud solution that helps you proactively monitor the performance of your applications and services — addresses this gap with a feature known as private probes.
Kubex releases data from a survey of over 500 U.S. software developers, revealing a disconnect between cost sensitivity, scrutiny and resource efficiency.
Over the past few years, Kubex has evolved from a cloud optimization product into a Kubernetes-centric solution, shifting its focus from cost and waste visibility to fully automated resource optimization. As that evolution happened, one of the earliest design decisions we had made began to show its limits: how the product was configured.
Smart test selection, parallel test runs, and intelligent caching can all speed up builds without sacrificing code quality. Fast, focused, and separate unit tests are very important for quick development. They give you feedback right away and make it easier to refactor with confidence. Unit tests are a quick and cheap way to find logic errors, but they can't check how different parts work together. For full coverage, use them with integration tests and end-to-end tests.