Operations | Monitoring | ITSM | DevOps | Cloud

The Place Where Modern Operations & Technology Come Together


GrafanaCONline Keynote
The official opening of GrarfanaCONline, the 2020 Grafana user conference. This keynote from the leadership of Grafana Labs focuses on where we’ve been and where we’re going, including a preview of the Grafana 7.0 release.
GrafanaCONline: Grafana 7.0
It’s Grafana 7.0 release day, and Grafana creator Torkel Ödegaard will talk about everything you need to know about the new features and enhancements.
GrafanaCONline: Slicing Kubernetes: Raspberry Pis, monitoring and chaos
Do you ever feel like your systems lack unnecessary complexity and overengineering? This is the talk for you. Join me as I detail the creation of a Raspberry Pi-based desktop Kubernetes cluster in an attempt to overcomplicate the already complex world of stateless web application deployment. We’ll walk through building an observability platform using open source tools like Prometheus, Grafana, and Jaeger to keep a close watch on our tiny fragile microservices and then break them intentionally for our own amusement.
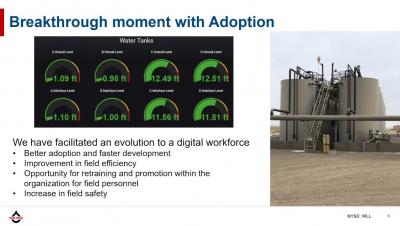
GrafanaCONline: Industrial process monitoring: oil and gas industry
We have been utilizing Grafana at Whiting Oil and Gas for approximately three years. In that time, we have greatly impacted the way our field assets are managed through dashboards and alerting. Instead of servers and network data, Whiting is using the application to monitor oil and gas wells in remote locations. Historically, the energy industry has deployed very expensive tools to monitor assets and visualize data.

Personalized music content search implementation
In this virtual meetup, we will go over step-by-step how we have replaced our music platform's search capabilities with Elasticsearch achieving better and personalized results based on user's previous music taste.
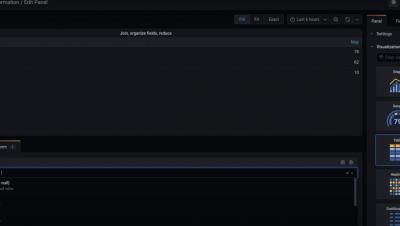
Grafana 7.0 New Feature: Transformations
Grafana 7.0 is coming in May! In the next days and weeks before it launches during GrafanaCONline, we'll be posting sneak previews of new features.
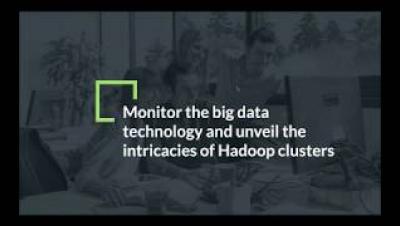
Unveil the intricacies of Hadoop clusters
Learn how you can monitor the big data technology, the availability and performance of your Hadoop clusters and maintain optimal performance.

Sysinternals for Linux
Mario Hewardt, Microsoft
For more information be sure to check out the WSL Website and wiki page
https://ubuntu.com/wsl
https://wiki.ubuntu.com/WSL
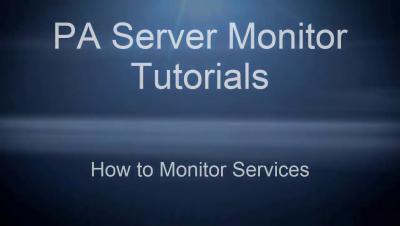
How to Monitor Services
Learn how to add a Service Monitor to your monitored server in PA Server Monitor. The Service Monitor watches the same system services that can be seen from the Administrator Tools Services applet (services.msc). If a service is not running, actions are fired (which could notify you and/or restart the service for example). The Restart Service action is typically attached to this monitor.