Operations | Monitoring | ITSM | DevOps | Cloud

The Place Where Modern Operations & Technology Come Together


The Unplanned Show, Episode 5: DataOps with Snowflake
Long gone are the days when data is batch loaded into a data warehouse for business intelligence reports that are looked at periodically and if something is broken, a few internal people would have to wait. Today, data pipelines are “infinitely more complicated”, with more sources from cloud services to on premises systems, and supporting data applications that are critical parts of a business’ ecosystem.

Spotting Vulnerabilities at Rest and at Runtime feat. Cloudsmith and Sysdig
The rise and popularity of containers and Kubernetes have revolutionised the IT industry but also introduced a lot of complexity including a huge number of vulnerabilities coming from different container image layers. To master those vulnerabilities both DevOps and Security teams are struggling to prioritise and address them, often without sufficient clarity or accountable insights.

Sentry in Six Minutes
Wondering what Sentry can do to keep you updated on actionable ways to improve your application? Check out this quick overview of Sentry's biggest features, then request a demo: https://sentry.io/demo/

Proven methods for elevating end-to-end tracking in Azure/Hybrid Integrations
Tracking end-to-end message or business data across Azure/hybrid integration and implementing end-to-end tracking presents a significant challenge for many organizations. To solve this problem, many rely on various monitoring tools like Log Analytics, App Insights, etc., designed for developers. However, when it comes to supporting applications in production or real-time for non-technical Azure operations/support teams, this approach can be challenging in terms of security and expertise.

Applying Service Management to HR for a Seamless Hybrid Workplace
Ivanti finds, heals, and protects every device, everywhere – automatically. Whether your team is down the hall or spread around the globe, Ivanti makes it easy and secure for them to do what they do best. Ivanti is IT for the way we work now. Integrated solutions for everything IT touches. So, employees can work better, anywhere, and everywhere.
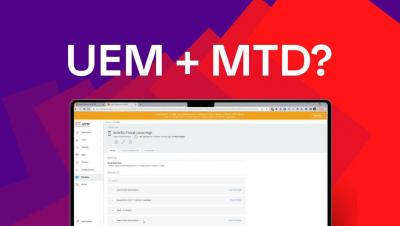
2023 Webinar UEM + Endpoint Security Part1
Ivanti finds, heals, and protects every device, everywhere – automatically. Whether your team is down the hall or spread around the globe, Ivanti makes it easy and secure for them to do what they do best. Ivanti is IT for the way we work now. Integrated solutions for everything IT touches. So, employees can work better, anywhere, and everywhere.
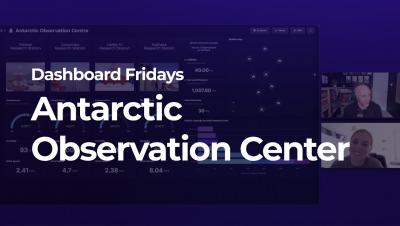
Dashboard Fridays: Antarctic Observation Center
This Antarctic Observation Center dashboard shows important weather data for each of the four key research stations, information on the areas of research that they cover, and the human capacity of each station. Built for fun using the SquaredUp Web API plugin, this dashboard streams data from multiple websites including OpenWeatherMap and the British Antarctic Survey, and combines them into one easy view.

Take back control of your Monitoring
The challenges in the monitoring world are known widely. We all know about these problems, what they are, and why they are important. While each one of the problems has its own solution, it all boils down to one thing – COST. How do we balance the tradeoffs without worrying about the huge costs of solving these challenges? For high-precision monitoring and observability, you need efficient and high-precision control levers. Take back control of your Monitoring with Levitate - a managed time series data warehouse.