Operations | Monitoring | ITSM | DevOps | Cloud

The Place Where Modern Operations & Technology Come Together

The latest News and Information on Log Management, Log Analytics and related technologies.


Modernizing financial services: A deep dive into Elastic Cloud on AWS for Observability, Security, and more
In the dynamic landscape of financial services, data is not just currency; it's the key to innovation and operational excellence. Data is constantly streamlining from devices, logins, transfers, transactions, and much more, and it’s bound to increase with an ongoing reliance on digital channels. This creates a massive opportunity and responsibility for financial institutions, as their customers (and regulators) demand more from banking providers.
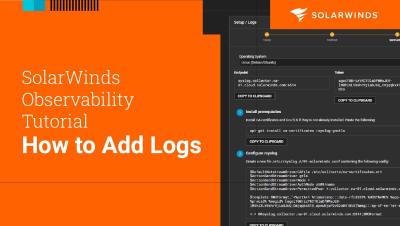
How to Add Logs | SolarWinds Observability Tutorial
For the latest live and on-demand product training, visit the Customer Portal: https://customerportal.solarwinds.com/login

Continuous Data: The Complete Guide
Data is never just data. There are structured and unstructured data, qualitative and quantitative data. Among these varied types, continuous data stands out as a key player, especially in the quantitative realm. Continuous data, with its infinite possibilities and precision, captures the fluidity of the real world — from the microseconds of a website’s load time to the fluctuating bandwidth usage on a network.

What is an API Gateway
When people bemoan the complexity of interconnected IT environments, they usually mean that an organization has a lot of applications that all share data with each other. As your organization adds more applications, you need to make sure that they securely share data with each other. In short, security and development teams find themselves working to deploy and protect the Application Programming Interfaces (APIs) that enable applications to talk to each other.

The Leading Observability Tools
Now, many teams are incorporating microservices architecture, with this trend only continuing. This allows them to employ their applications across distributed environments. Whilst this is advantageous as it makes it much simpler to build, scale, and deliver it can also become much more challenging to monitor and troubleshoot the components that make up the environment.

A Guide to Log4j for Logging in Java
Log4j is a logging framework for Java, facilitating the systematic recording of runtime information in software applications. Developed by the Apache Software Foundation, Log4j has become a standard tool in Java development since its inception in 1996. Its primary purpose is to generate log messages that provide insights into the application's execution, aiding developers in debugging, monitoring, and analysing software behaviour.


Creating Spring-based gRPC microservices managed by Prometheus and Grafana
Create microservices with gRPC with Spring, and leverage Managed Service for Prometheus and Grafana for monitoring and observability.