Operations | Monitoring | ITSM | DevOps | Cloud

The latest News and Information on Log Management, Log Analytics and related technologies.

How to monitor MongoDB with OpenTelemetry

MongoDB is a document-oriented and cross-platform database that maintains its documents in the binary encoded JSON format. Mongo’s replication capabilities and horizontal capability using sharding make MongoDB highly available. An effective monitoring solution can make it easier for you to identify issues with MongoDB such as resource availability, execution slowdowns, and scalability. observIQ recently built and contributed a MongoDB metric receiver to the OpenTelemetry contrib repo.

Application logging with Flask

Without logs, or a good understanding of them, debugging an application or looking through an error stack trace can be challenging. Luckily, Flask logging can change the way you understand debugging and how you interact with logs produced by the application. The Flask logging module gives you a way to record errors over different severity levels. A default logging module is included in the Python standard library, and it provides both simple and advanced logging functions.

Retrace Power User Tips and Tricks - Error and Log Management

The explosive growth of ecommerce has slowed in the last year. But the need for businesses to deliver a great digital user experience continues to grow. Companies that don’t rely on online customer purchases can still suffer blows to revenues due to a poor online experience. Market conditions are raising the importance of Application Performance Monitoring (APM) tools to ensure every digital interaction with your company is positive. APM tools vary by design, features and functionality.

Log Observer Connect: Leverage the power of Splunk Enterprise data in Splunk Observability Cloud

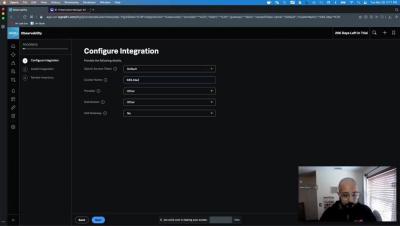
With Splunk Log Observer Connect it’s easier than ever to correlate all of your metric, trace and log data to deliver better customer experiences! Available now for existing Splunk Enterprise and Splunk Observability Customers. Log Observer Connect lets observability users explore the data they’re already sending to their existing Splunk instances with Splunk Log Observer’s intuitive no-code interface integrated in Splunk Observability, for faster troubleshooting, root-cause analysis and better cross-team collaboration.