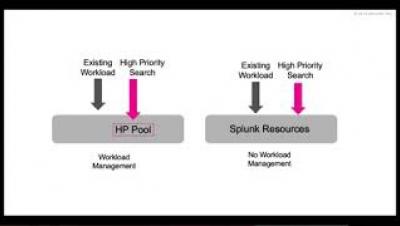
High Priority Search Execution with Splunk Workload Management
This short video talks about different use cases where workload management may be used. It also demonstrates high priority search execution use case.


The latest News and Information on Log Management, Log Analytics and related technologies.
ELK and Kubernetes are used in the same sentence usually in the context of describing a monitoring stack. ELK integrates natively with Kubernetes and is a popular open-source solution for collecting, storing and analyzing Kubernetes telemetry data. However, ELK and Kubernetes are increasingly being used in another context — that of a method for deploying and managing the former.
What a pleasure it was to see many of our customers at our Illuminate user conference, September 11-12. We had record attendance from customers, influencers, and partners. Our time was packed with keynotes, customer presentations (35 customer breakout sessions), certifications, sharing best practices, and time networking and having fun together.
Jim Barksdale, former CEO of Netscape, once said “If we have data, let’s look at data. If all we have are opinions, let’s go with mine.” While Jim may have said this in jest, the exponential boom in data collection indicates that we increasingly prefer to rely on facts rather than conjecture when making business decisions. More data yields greater insights about customer preferences and experiences, internal processes, and security vulnerabilities — just to name a few.
Everything old is new again–that’s a universal law! In our industry, we have talked about Service Level Agreements (SLAs) for a long time. At Sumo, we are proud to continue to be the only Machine Data Analytics Platform as a Service that commits to a query performance SLA.
Log file parsing is the process of analyzing log file data and breaking it down into logical syntactic components. In simple words - you’re extracting meaningful data from logs that can be measured in thousands of lines. There are multiple ways to perform log file parsing: you can write a custom parser or use parsing tools and/or software.
Massively scaling free-text search has always been the holy grail in big data. Many software firms now face the burgeoning challenge of searching through previously untapped data sources and the current trend is far surpassing the petabyte scale. Here at LogDNA we manage free-text search for thousands of customers with distinct traffic profiles across a multitude of Elasticsearch clusters.
Log files in Linux often contain information that can assist in tracking down the cause of issues hampering system or network performance. If you have multiple servers or levels of IT architecture, the number of logs you generate can soon become overwhelming. In this article, we’ll be looking at some ways to ease the burden of managing your Linux logs.