Operations | Monitoring | ITSM | DevOps | Cloud

The latest News and Information on Monitoring for Websites, Applications, APIs, Infrastructure, and other technologies.

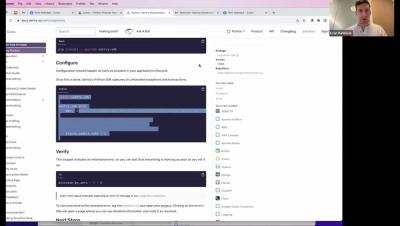
Migrating to Icinga DB

Although Icinga DB has been around for some time and many customers and users are already using it, there may still be some who are wondering how to upgrade/migrate to Icinga DB. This post will briefly explain the components of the Icinga DB and how to install them in a reasonable order. Note that it is assumed that all components are installed on the Icinga primary node(s) using a MySQL/MariaDB database.

Grafana JSON API: How to import third-party data sources in Grafana Cloud

Have you ever wanted to test out Grafana Cloud but don’t have any available data to monitor? Well, have no fear! With the Grafana JSON API plugin, you can query publicly available JSON endpoints. The JSON API is a wonderful way to start using Grafana Cloud. You can quickly see data in action, and there are a multitude of things you can build, analyze, and monitor using the JSON API.

How to configure Grafana Incident with Microsoft Teams

Grafana Incident, the powerful incident response tool that is part of the Grafana IRM suite in Grafana Cloud, comes with a range of integrations out of the box, including Zoom and Google Meet spaces, GitHub and JIRA issues, and even a Google Doc template for post-incident review documents. One of the key features in Grafana Incident is the chatbot integration, which previously only supported Slack.

Getting started with RabbitMQ

RabbitMQ is an open-source message broker software that facilitates communication and data exchange between various components of distributed applications. Acting as an intermediary, RabbitMQ enables different software systems, services, and devices to exchange information in a seamless and efficient manner. It follows the Advanced Message Queuing Protocol (AMQP), a standardized communication protocol designed for robust and scalable messaging.

Simplifying Microservices Debugging on Kubernetes with Istio, OTel, and Apica

Microservices architecture has become increasingly popular in modern software development due to its scalability, resilience, and flexibility. However, with the benefits of microservices come the challenges of debugging and monitoring these distributed systems. Using the Istio service mesh, OpenTelemetry distributed tracing, and Apica’s Kubernetes-native observability platform, developers can easily collect and visualize performance data in real-time to identify and fix issues quickly.

Azure Service Bus Dead-Letter Queue Monitoring

Azure Service Bus, a cloud-based messaging service, facilitates communication between applications and services. Within Azure Service Bus queues and topic subscriptions, there exists an additional sub-queue known as a Azure Service Bus dead-letter queue (DLQ). The Dead-Letter Queue (DLQ) serves as a storage area for messages that the receiving application from the main queue cannot deliver or process successfully. These messages are referred to as “dead-lettered” messages.