Operations | Monitoring | ITSM | DevOps | Cloud

Monitoring

The latest News and Information on Monitoring for Websites, Applications, APIs, Infrastructure, and other technologies.

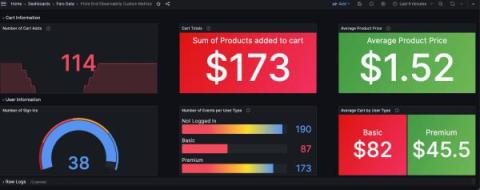
How to use the Grafana Faro Web SDK with Grafana Cloud Frontend Observability to gain additional app insights

Frontend observability (or real user monitoring) is a critical, yet often overlooked, part of systems monitoring. Website and mobile app frontends are just as complex, if not more so, than the backend systems observability teams typically prioritize. They also represent the first interaction users have with our applications — so it’s important to have full visibility into that experience.

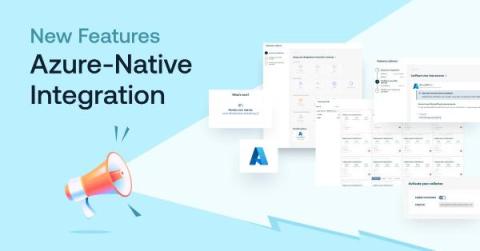
Simplify Azure Monitoring with Logz.io's New Azure-Native Integration

If you’re looking to monitor Microsoft Azure infrastructure with Logz.io, we’re now making it easier than ever with our new Azure-native integration Typically, collecting infrastructure metrics from Azure involves installing and configuring data collection components on your system, such as Prometheus, Telegraph, or a number of proprietary agents that are specific to different vendors.

A Comprehensive Guide to Network Device Monitoring

As technology advances, the networks required to support it have evolved into complex, interconnected systems that are vital to each organization’s operations. When a network issue causes service interruptions or unexpected downtime, it can have serious consequences not only for service performance but also for the company’s bottom line. Sometimes, all it takes is an overloaded device or a faulty connection, and suddenly everything grinds to a halt.

Grafana Loki 2.9 release: TSDB volume endpoints, remote rule evaluations, LogQL optimizations

The Loki squad is excited to announce Grafana Loki 2.9 is here! For this release, we’ve developed additional TSDB endpoints to help you better understand your log volume; introduced query language optimizations to make parsing more performant; and restructured our documentation so it is easier to use. This coincides with the release of Grafana Enterprise Logs (GEL) 1.8, so all the features discussed here are available in both Loki 2.9 and GEL 1.8.

Hot Topic: Increasing Cost-Efficient Observability with Cold Tier

Even as the global economy shows signs of a rebound, today’s observability customers are more focused than ever on driving utmost value from their investments. This isn’t simply because economics have forced organizations to closely review overhead and drive out unnecessary costs; the reality is that observability has become one of the leading budget items for every cloud software organization, full stop.

An Introduction to the OWASP API Security Top 10

If you ever watched Stargate, then you have some understanding of how application programming interfaces (APIs) work. While APIs don’t give you the ability to traverse the galaxy using an alien wormhole, they do act as digital portals that allow data to travel between applications. However, as sensitive data moves from one application to another, each API becomes a potential access point that threat actors can exploit.

Top 10 LogicMonitor Alternatives

In today's fast-paced digital world, businesses rely heavily on IT infrastructure monitoring tools to ensure optimal performance and reliability. LogicMonitor has carved a niche in the market as a comprehensive monitoring solution for complex IT environments. However, the recent security mishap has pushed us to look for other alternatives as well. Fairly recently, LogicMonitor was in hot waters for its weak default passwords, ultimately leaving them vulnerable to ransomware attacks.