Operations | Monitoring | ITSM | DevOps | Cloud

The Place Where Modern Operations & Technology Come Together

The latest News and Information on Monitoring for Websites, Applications, APIs, Infrastructure, and other technologies.


We've Redesigned Our Charts at AppSignal: 6 New Features
AppSignal is excited to announce that we've given our charts a major makeover, making them more powerful and user-friendly. We've rebuilt our charts from the ground up.

Redefining RUM: A Comparative Gap Analysis of Existing Tools
Real user monitoring (RUM) began as a straightforward approach to tracking basic web performance metrics. Focused on things like page load times and response rates, RUM relied on server-side logging and simple browser timings. While these tools captured Core Web Vitals (CWVs), they offered limited insights into how users actually interacted with pages, focused mainly on server-side performance.

Understanding Java Logs
Logs are the notetakers for your Java application. In a meeting, you might take notes so that you can remember important details later. Your Java logs do the same thing for your application. They document important information about the application’s ability to function and problems that keep it from working as intended. Logs give you information to help fix coding errors, but they also give your end users information that helps them monitor performance and security.

Hurricane Helene Devastates Network Connectivity in Parts of the South
In this post, we dig into the impacts from Hurricane Helene which came ashore late last month wreaking destruction and severe flooding in the Southeastern United States. Using Kentik’s traffic data as well as Georgia Tech’s IODA, we detail the impacts in three of the hardest-hit states: Georgia, South Carolina, and North Carolina.

Icinga Notifications: Custom Channel Plugins
As many of you have already seen in our previous blog posts and our early beta release, we’re working on a new, independent notification module. Right now, we only offer three ready-made channels for sending notifications. Today, I want to show you how you can create your own channel and add it to the Icinga Notifications module. In this blog post, I’ll show you how to build a bridge to Telegram and send new notifications to a group chat.
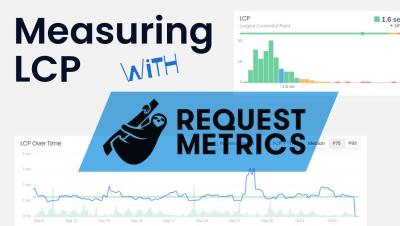
Measuring Largest Contentful Paint with Request Metrics
Measuring Largest Contentful Paint (LCP) is important because it helps you understand how quickly the main content of a web page loads and becomes visible to users. LCP focuses on when the largest visible element—like a hero image, heading, or video—renders in the viewport, making it a key indicator of perceived load speed. Optimizing for LCP ensures faster, smoother interactions, enhancing both user satisfaction and search engine ranking. Let's see how you can get to the bottom of any LCP problems in Request Metrics!

Driving Unparalleled Growth for MSPs and Deliver Value for Their Clients with ScienceLogic
Since ScienceLogic was founded in 2003, our goal has been to support our partners, including Managed Service Providers (MSPs), with solutions that help them and their clients gain unparalleled visibility into their IT environments. Our objective has always been to help these organizations bring order to complexity, turn inefficiencies into productivity, and, in the process, help service providers and the companies they serve exceed their business objectives.

How to Build a Data Migration Plan? A Step By Step Guide
Data growth is growing at an extraordinary pace, with a compound annual growth rate (CAGR) of 28% projected over the next few years. For organizations dealing with logs, metrics, and traces, this massive data expansion brings both opportunities and challenges. As data volumes soar, having flexibility in where you store and analyze it—whether in a SIEM, object storage, or other platforms—has become essential.
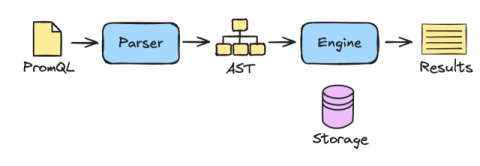
Inside PromQL: A closer look at the mechanics of a Prometheus query
Even though I’m a Prometheus maintainer and work inside the Prometheus code, I found many of the details of PromQL, the Prometheus query language, obscure. Many times I would look something up, or go deep into the code to find out exactly what it did, only to forget it again the next month. So, trying to live up to my job title of Distinguished Engineer at Grafana Labs, I resolved to write the definitive guide: what really happens when I execute a PromQL query?