Operations | Monitoring | ITSM | DevOps | Cloud
Monitoring
The latest News and Information on Monitoring for Websites, Applications, APIs, Infrastructure, and other technologies.
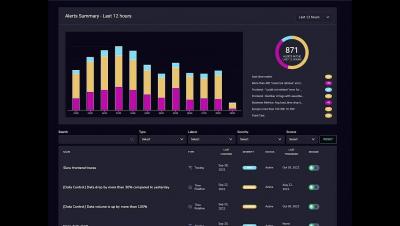
Alerting Dashboard Overview
Release webinar: SquaredUp v5.6
Unity Performance Testing Tools & Benchmarks
The following guest post addresses how to improve your services’ performance with Sentry and other application profilers for Unity. Learn more about Sentry’s Profiling product or try it out now if you’re already a Sentry user. We’re making intentional investments in performance monitoring to give relevant context to help you solve what’s urgent faster.
Fixing SCOM Blind Spots - Introducing EAM-X, and loads more with SquaredUp v5.5!
Feature Focus: September 2022
Another month has come to a close, so I’m back again to take you through what’s new and noteworthy from the month of September. If you missed last month’s blog, this will be a monthly recurring series to keep you posted with the latest and greatest at Honeycomb. There’s a ton to cover, so I’ll dispense with the preamble and dive right in.
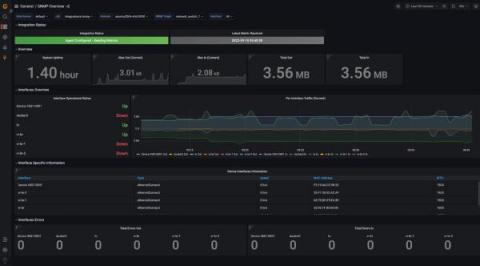
Set up instant SNMP monitoring with the new SNMP integration in Grafana Cloud
Simple Network Management Protocol (SNMP) is an internet protocol that is used to collect information about network devices and manage them. Most of the modern devices connected to a network support SNMP, such as routers, switches, servers, printers, and more. There are three different versions of SNMP (v1, v2, and v3). It most commonly operates on UDP ports 161 and 162. The most common versions being used are v1 and v2. The data can be collected from a network device through SNMP via polling.
10 Tools for Monitoring Mobile Apps from a Network Point of View
With so many apps to choose from, mobile users no longer have much patience for apps that don’t work well. This isn’t just about bugs and crashes; users also think about how fast the app works and how much battery it uses. But have you ever thought about what would happen to the business if your live applications running on the client’s systems went down or didn’t work as expected?
Monitoring Strategies: An Introductory Guide With 5 Examples
Monitoring is an integral part of most organizations. The monitoring process usually consists of several tools that, combined, show you information about whatever you're monitoring - applications, infrastructure, networks and so forth. While monitoring may seem like an obvious practice to some, it can be challenging to establish the best monitoring strategy for your organization.
Cloud Monitoring further embraces open source by adding PromQL
As Kubernetes monitoring continues to standardize on Prometheus as a form factor, more and more developers are becoming familiar with Prometheus’ built-in query language, PromQL. Besides being bundled with Prometheus, PromQL is popular for being a simple yet expressive language for querying time series data. It’s been fully adopted by the community, with lots of great query repositories, sample playbooks, and trainings for PromQL available online.


