Operations | Monitoring | ITSM | DevOps | Cloud
Observability
The latest News and Information on Observabilty for complex systems and related technologies.
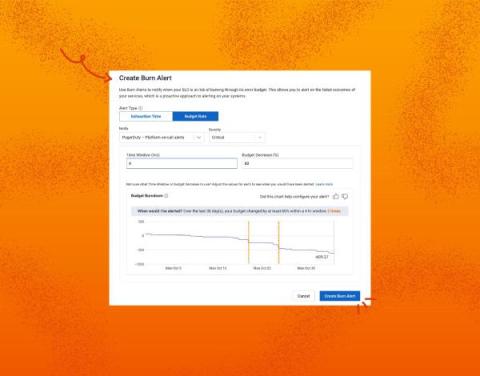
From Oops to Ops: SLOs Get Budget Rate Alerts
As someone living the Honeycomb ops life for a while, SLOs have been the bread and butter of our most critical and useful alerting. However, they had severe, long-standing limitations. In this post, I will describe these limitations, and how our brand new feature, budget rate alerts, addresses them. We usually don’t have SREs writing product announcements, but I’m so excited about this one that I said, “Screw it, I’m doing it!”
Managing observability spend with Grafana Cloud's Cost Management Hub
Cisco Cloud Observability on AWS: Deploying is easy with the AppDynamics add-on for Amazon EKS Blueprints with Terraform
Quickly deploy the Cisco AppDynamics Kubernetes® and App Service Monitoring solution for cloud native application observability using Helm charts and Amazon EKS Blueprints for Terraform module. In this blog, I’ll show you how to deploy the AppDynamics Kubernetes and App Service Monitoring solution for cloud native application observability using Helm charts and the Amazon EKS Blueprints for Terraform module. Now, you can do it in just minutes.
How Asserts.ai will make it even easier for Grafana Cloud users to understand their observability data
At Grafana Labs, our mission has always been to help our users and customers understand the behavior of their applications and services. Over the past two years, the biggest needs we’ve heard from our customers have been to make it easier to understand their observability data, to extend observability into the application layer, and to get deeper, contextualized analytics.
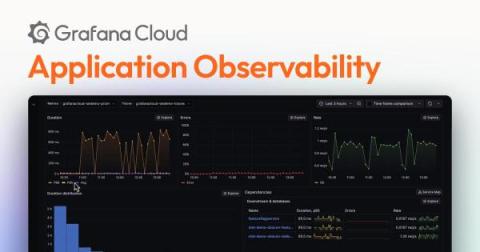
Announcing Application Observability in Grafana Cloud, with native support for OpenTelemetry and Prometheus
The Grafana LGTM Stack (Loki for logs, Grafana for visualization, Tempo for traces, and Mimir for metrics) offers the freedom and flexibility for monitoring application performance. But we’ve also heard from many of our users and customers that you need a solution that makes it easier and faster to get started with application monitoring.
Enhancing SRE troubleshooting with the AI Assistant for Observability and your organization's runbooks
With this guide, empower your SRE team to achieve enhanced alert remediation and incident management.
How to Create Log-Based Metrics to Improve Application Observability
As a Site Reliability Engineer (SRE) or DevOps professional, you are well aware of the importance of observability in ensuring the smooth functioning and performance of your applications. Observing and monitoring your applications can help you identify and resolve issues in real-time, resulting in increased reliability and improved user experience. Logs play a crucial role in this process as they provide detailed information about the activity and behavior of your applications.
Selecting Observability and Security Solutions in Compliance with RBI: Fintech Challenges
Fintech, an abbreviation for financial technology, encompasses many firms and technologies that employ innovation and tech to enhance and automate financial services and operations. Their goal is to enhance the efficiency, accessibility, and user-friendliness of financial services. Fintech entities span numerous sectors within the financial industry, such as online payments, lending, digital banking, investing, insurance, and more, all aimed at streamlining financial processes.
What Do Developers Need to Know About Kubernetes, Anyway?
Stop me if you’ve heard this one before: you just pushed and deployed your latest change to production, and it’s rolling out to your Kubernetes cluster. You sip your coffee as you wrap up some documentation when a ping in the ops channel catches your eye—a sales engineer is complaining that the demo environment is slow. Probably nothing to worry about, not like your changes had anything to do with that… but, minutes later, more alerts start to fire off.


