Operations | Monitoring | ITSM | DevOps | Cloud

How to manage Elasticsearch data across multiple indices with Filebeat, ILM, and data streams

Indices are an important part of Elasticsearch. Each index keeps your data sets separated and organized, giving you the flexibility to treat each set differently, as well as make it simple to manage data through its lifecycle. And Elastic makes it easy to take full advantage of indices by offering ingest methods and management tools to simplify the process.

Why we're partnering with Elastic to build the Elasticsearch plugin for Grafana

As I’ve often talked about before, we have a “big tent” philosophy at Grafana Labs. We believe our users should determine their own observability strategy and choose their own tools; Grafana allows them to bring together and understand all their data, no matter where it lives. In practice, that means that we want to support data sources that our users are passionate about.

Elasticsearch caching deep dive: Boosting query speed one cache at a time

Cache is king for speedy data retrieval. So if you’re interested in how Elasticsearch leverages various caches to ensure you are retrieving data as fast as possible, buckle up for the next 15 minutes and read through this post. This blog will shed some light on various caching features of Elasticsearch that help you to retrieve data faster after initial data accesses.

Elastic searchable snapshots or AWS UltraWarm: Making the right choice

Your logs, metrics, security, and trace data are all invaluable to you. They are mission critical for your observability and security needs. As your IT infrastructure grows and keeps generating more and more data, your data volumes and data storage needs go up accordingly. It can quickly become cost-prohibitive to indefinitely store all of it on your hottest machines.

Analyzing Elastic Workplace Search usage in a Kibana dashboard - part 2

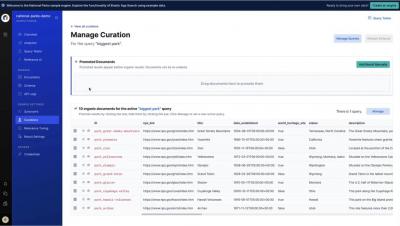
For the 7.10 release of Elastic Workplace Search, we highlighted some of the new analytics logging capabilities and took you through a short walkthrough of some sample analysis scenarios. With the 7.11 release we introduced analytics fields, which open up new possibilities for exploring query and click data with helpful dashboards and visualizations.

Ruby and Python clients for Elastic Enterprise Search now generally available

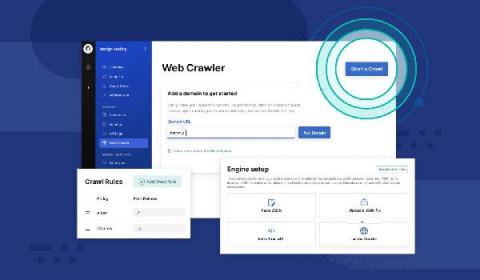
Back in our 7.10 release of the Elastic Stack, we announced the beta of our Ruby and Python clients for Elastic Enterprise Search. Now, with 7.11, both the Ruby and Python clients are generally available. We’ve also begun work on a PHP client. All client source code for both enterprise-search-ruby and enterprise-search-python is available on GitHub. Documentation on how to get started with each client is available on elastic.co.

Testing the new Elasticsearch cold tier of searchable snapshots at scale

The cold tier of searchable snapshots, previously beta in Elasticsearch 7.10, is now generally available in Elasticsearch 7.11. This new data tier reduces your cluster storage by up to 50% over the warm tier while maintaining the same level of reliability and redundancy as your hot and warm tiers.

Shadow an Indexed Field With a Runtime Field to Fix Errors

The video contains a demonstration of using a runtime field to fix errors in the indexed data. We intentionally index documents with some errors, and then use a runtime field to shadow the indexed field. The demonstration shows how a user querying the data or creating a visualization in Kibana Lens will see the correct information, which is calculated in the runtime field. This scenario allows for immediate fixing of errors in the indexed data by shadowing them with runtime fields (instead of reindexing). Runtime field is the name given to the implementation of schema on read in Elasticsearch.