Operations | Monitoring | ITSM | DevOps | Cloud

Logging

The latest News and Information on Log Management, Log Analytics and related technologies.

Simplifying Data Lake Management with an Observability Pipeline

Data Lakes can be difficult and costly to manage. They require skilled engineers to manage the infrastructure, keep data flowing, eliminate redundancy, and secure the data. We accept the difficulties because our data lakes house valuable information like logs, metrics, traces, etc. To add insult to injury, the data lake can be a black hole, where your data goes in but never comes out. If you are thinking there has to be a better way, we agree!

Lookup Tables and Log Analysis: Extracting Insight from Logs

Extracting insights from log and security data can be a slow and resource-intensive endeavor, which is unfavorable for our data-driven world. Fortunately, lookup tables can help accelerate the interpretation of log data, enabling analysts to swiftly make sense of logs and transform them into actionable intelligence. This article will examine lookup tables and their relationship with log analysis.

Top Elasticsearch Metrics to Monitor | Troubleshooting Common error in Elasticsearch

Monitoring Elasticsearch metrics is absolutely essential! Monitoring gives you information about the functionality, overall condition, and performance of your Elasticsearch cluster. Without monitoring, you risk missing important “red-flags” that could make your cluster inaccessible or crash. Which could result in data loss and downtime; both of which would be expensive for your company.

A Complete Guide to Tracking CDN Logs

The Content Delivery Network (CDN) market is projected to grow from 17.70 billion USD to 81.86 billion USD by 2026, according to a recent study. As more businesses adopt CDNs for their content distribution, CDN log tracking is becoming essential to achieve full-stack observability. That being said, the widespread distribution of the CDN servers can also make it challenging when you want visibility into your visitors’ behavior, optimize performance, and identify distribution issues.

Parsing logs with the OpenTelemetry Collector

This guide is for anyone who is getting started monitoring their application with OpenTelemetry, and is generating unstructured logs. As is well understood at this point, structured logs are ideal for post-hoc incident analysis and broad-range querying of your data. However, it’s not always feasible to implement highly structured logging at the code level.

What Is ITOPs? IT Operations Defined

IT operations, or ITOps, refers to the processes and services administered by an organization's IT staff to its internal or external clients. Every organization that uses computers has a way of meeting the IT needs of their employees or clients, whether or not they call it ITOps. In a typical enterprise environment, however, ITOps is a distinct group within the IT department. The IT operations team plays a critical role in accomplishing business goals.

Developing the Splunk App for Anomaly Detection

Anomaly detection is one of the most common problems that Splunk users are interested in solving via machine learning. This is highly intuitive, as one of the main reasons our Splunk customers are ingesting, indexing, and searching their systems’ logs and metrics is to find problems in their systems, either before, during, or after the problem takes place. In particular, one of the types of anomaly detection that our customers are interested in is time series anomaly detection.

Exploring & Remediating Consumption Costs with Google Billing and BindPlane OP

We’ve all been surprised by our cloud monitoring bill at one time or another. If you are a BindPlane OP customer ingesting Host Metrics into Google Cloud Monitoring, you may be wondering which metrics are impacting your bill the most. You may have metrics enabled that aren’t crucial to your business, driving unnecessary costs. How do we verify that and remediate?

BindPlane OP Architecture Overview

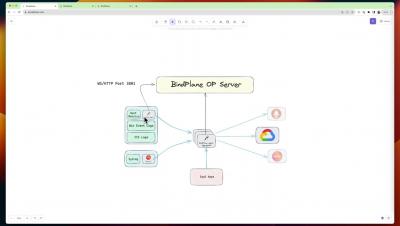
In this overview we dive into the BindPlane architecture focusing on the two main components. 1) BindPlane OP Server: acts as a orchestration layer that all of your agents are connected to giving you visibility into what is happening. 2) BindPlane Agent: is a distribution of the OpenTelemetry collector, sitting on your edge nodes collecting your telemetry data or acting as an aggregator (or gateway node) collecting from other edge devices and then routing to your destinations.

How Gaming Analytics and Player Interactions Enhance Mobile App Development

The number of mobile game users is expected to increase to 2.3 billion users by 2027, with a CAGR of 7.08%. The resulting projected market volume is a staggering $376.7 billion by 2027. Competition is fierce, and differentiation is key to winning out in this rapidly growing market. To understand their users and build better games, gaming companies need to use data analytics to interpret how players interact with their games. Effective use of video game data can help companies.