Operations | Monitoring | ITSM | DevOps | Cloud

Integration

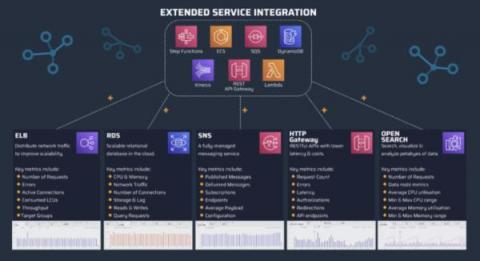
Dashbird now integrates with 5 new AWS services

TL;DR: Dashbird launches observability for five new AWS services (ELB, SNS, RDS, OpenSearch, and HTTP API Gateway) to allow for a faster, more secure, and smoother serverless observability experience. Dashbird, the leading monitoring platform for serverless AWS applications, announces five new AWS integrations.

High Five: The Latest Integrations from Splunk, Microsoft and GitHub

Hello Splunk Nation! Welcome to the latest roundup of Splunk integrations with Microsoft and GitHub! Hopefully, you had a chance to virtually attend.conf21 and check out all the amazing content. For those of you who missed it, we’re recapping the Microsoft, GitHub and Splunk highlights below.

Your First Shipa Webhook - Microsoft Teams Integration

One more “ops” phoneme like DevOps is ChatOps; or conversation-based development/operations. ChatOps has been growing in popularity as communication platforms such as Slack is ingrained in our day-to-day engineering lives. A team lead once told me “if it didn’t happen in Slack, it didn’t happen” showing the emphasis of communication platforms as a system of record.

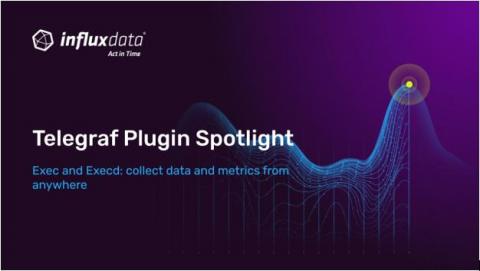
Plugin Spotlight: Exec & Execd

Telegraf comes included with over 200+ input plugins that collect metrics and events from a comprehensive list of sources. While these plugins cover a large number of use cases, Telegraf provides another mechanism to give users the power to meet nearly any use case: the Exec and Execd input plugins. These plugins allow users to collect metrics and events from custom commands and sources determined by the user.

Sponsored Post

Leveraging Your Integration Infrastructure

The investment your organization has made in integration infrastructure (i2) over the years was necessary as the organization and the IT infrastructure grew, but it has likely been considered a necessary evil by senior management. However now that investment can be leveraged in two important new ways.

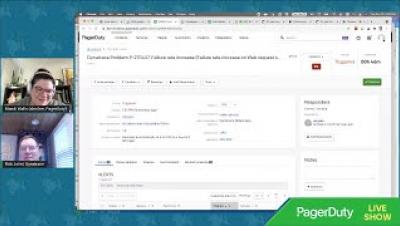
Partner Integration - Dynatrace with PagerDuty and Rundeck

Deliver perfect software experiences with real-time intelligence into customer satisfaction and behavior, your applications, and the performance of your hybrid multi-cloud. AI-powered root-cause analysis automatically identifies customer facing performance issues and pinpoints the root-cause within seconds. Open APIs allow ingestion of 3rd party metrics and enable complex system integrations. In this demo, Rob Jahn shares a sophisticated incident remediation workflow incorporating intelligence from Dynatrace, automation in Rundeck, and incidents in PagerDuty.

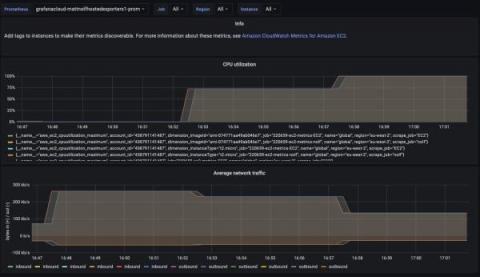
Introducing the AWS CloudWatch integration, Grafana Cloud's first fully managed integration

At Grafana Labs, we are continuing to build integrations that make it easier than ever to observe your systems, no matter which tools or software you choose. Today, we’re excited to talk about the latest integration available in Grafana Cloud: the AWS CloudWatch metrics integration, the first of our fully managed integrations that makes it simple to connect and visualize your data in Grafana.

Partner Integration on Twitch: Lacework

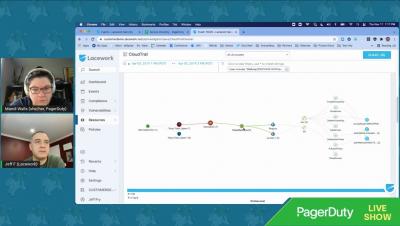
Lacework delivers complete #security and #compliance for the cloud. While the cloud enables enterprises to automatically scale workloads, deploy faster, and build freely, it also makes it increasingly difficult to: maintain visibility, remain compliant, stay free from known vulnerabilities, and track activity in both host workloads and ephemeral infrastructure within their environments. Integrate Lacework with PagerDuty to route Lacework Events to responders on your team. Manage and resolve configuration issues, behavioral anomalies, and compliance requirements in a timely manner across your cloud infrastructure.

The 18 most popular data source plugins for Grafana in 2021

As a composable solution, Grafana allows you to bring your data into dashboards natively without having to extract it, load it, or transform it. We believe in a “big tent” philosophy, which allows you to choose the tools that best suit your observability strategy, and with our plugins, Grafana is interoperable with more than 100 data sources.

New Apps for PagerDuty's Datadog Integration

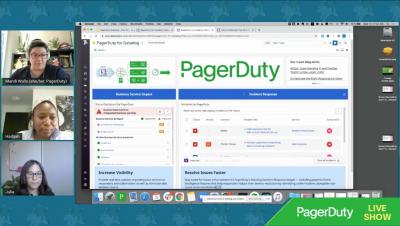
Status Dashboard by PagerDuty and Incidents by PagerDuty are new apps available now in Datadog. See a live, shared view of system health to improve awareness of operational issues with Status Dashboard by PagerDuty. Acknowledge, troubleshoot, and resolve incidents with PagerDuty actions embedded directly in the Datadog interface to limit context switching among tools. Julia Nasser and Hadijah Creary join the stream to show off this powerful enhanced integration.